
by K.T. Weaver, SkyVision Solutions
 I was recently asked to respond to a question posed by a ComEd customer regarding the technical content of a ComEd “Radio Frequency Fact Sheet” on smart meters. [1] Upon review and without taking a strong position either way on the degree to which smart meter emissions may cause adverse health effects, it can easily be demonstrated that the “fact sheet” is nothing more than biased propaganda.
Prominently featured as part of the “fact sheet’ is an “adapted” version of a chart from a report originally published by the California Council on Science and Technology (CCST) in 2011. [2] This chart is intended to compare the radiofrequency (RF) emissions for various wireless technologies. It is evident that ComEd chose to exaggerate the already biased CCST report by removing the lower range values listed in the CCST chart and only reporting the “maximum” signal strength values as indicated on the y-axis of the chart.
A value of 5000 microwatts per cm2 is listed on the chart as representative for cell phones. This value is “possible” but must also be considered as a non-typical exposure value for localized exposure to the ear from a cell phone. Keep in mind that it is to ComEd’s benefit to make the cell phone RF emission value look as high as possible. The 5000 RF cell phone number is based upon a calculation where the phone’s output is 250 millwatts and the phone continuously operates at that level. [3] All hand-held cell phones in use today utilize “adaptive power control,” which means they transmit with the lowest possible power to allow communication with the nearest base station. Smart grid advocates don’t account for this reality when comparing cell phone and smart meter emissions. Although adaptive power control has the effect of lowering RF exposure, it was primarily developed in order to conserve battery power as well as to reduce interference problems that would otherwise occur if all phones were transmitting at maximum power all the time.
In a submittal to the Federal Communications Commission (FCC), dated September 3, 2013, the Telecommunications Industry Association (TIA) indicated that “recent analyses of actual exposure conditions demonstrate that the systems currently operate to provide exposures well below that expected by users who refer to reported SAR levels. A recent Swedish study found that after assessing output power from more than 800,000 hours of voice calls, the average level for 3G or smartphone voice calls was below 1 mW across all environments, including rural, urban, and dedicated indoor networks.” This referenced study is entitled “Output Power Distributions of Terminals in a 3G Mobile Communication Network,” published in Bioelectromagnetics, May 2012. [4] [5] [6]
Thus, a simple substitution using the 1 milliwatt more typical power output in place of 250 milliwatts would change the value on the ComEd chart for “cell phone at ear” from 5000 to 20 microwatts per cm2. [Note: 1/250 = 0.4%]
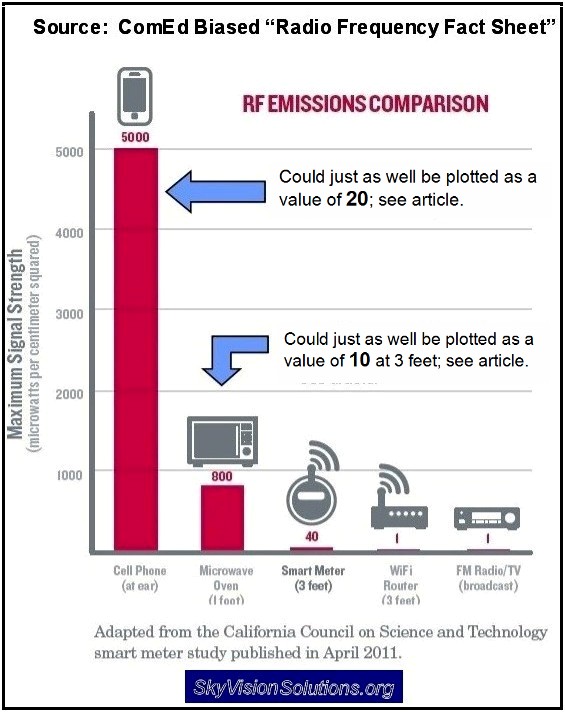
The RF value of 800 microwatts per cm2 for a microwave oven in the ComEd chart is arbitrarily specified for a distance of one (1) foot. Who normally stands one foot from their microwave? This value is believed to have been calculated based upon the safety design leakage rate permitted for household microwave ovens. [7] Actual testing results are readily available for microwave ovens at distances of 1 meter (and 3 feet), the same basic distance as listed for the smart meter in the chart. See below.
Richard Tell Associates performed measurements on two (2) separate microwaves during a study in the state of Vermont. The test results were almost identical at a distance of 3 feet, indicating a power density of 10 microwatts per cm2. [Reference: “An Evaluation of Radio Frequency Fields Produced by Smart Meters Deployed in Vermont,” by Richard Tell Associates, Inc., page 75, dated, January 14, 2013. ]
EMC Technologies also performed measurements for a microwave that showed a result of 6.1 microwatts per cm2 at one (1) meter. [Reference: “AMI Meter Electromagnetic Field Survey,” EMC Technologies, Final Report, Table 30, October 20, 2011.]
Richard Tell Associates in a document entitled, “Summary Discussion of RF Fields and the PG&E SmartMeter System (2005 Report and 2008 Supplement),” quotes a value for a “Typical RF field in kitchen with operating microwave [1 meter]” as 10 microwatts per cm2.
Thus, based upon industry test results for household microwaves, a value of 10 microwatts per cm2 for a microwave oven would be appropriate to list on the chart for the specified distance of 3 feet.
So the facts on RF emissions from various devices are actually consistent with the somewhat more objective conclusion reached in the EPRI report from which the CCST report and ComEd chart are supposedly based:
“The average exposure levels from smart meters, as measured in the current study, are at levels similar to those that are present from other common RF sources, both indoor and outdoor.” [8] [emphasis added]
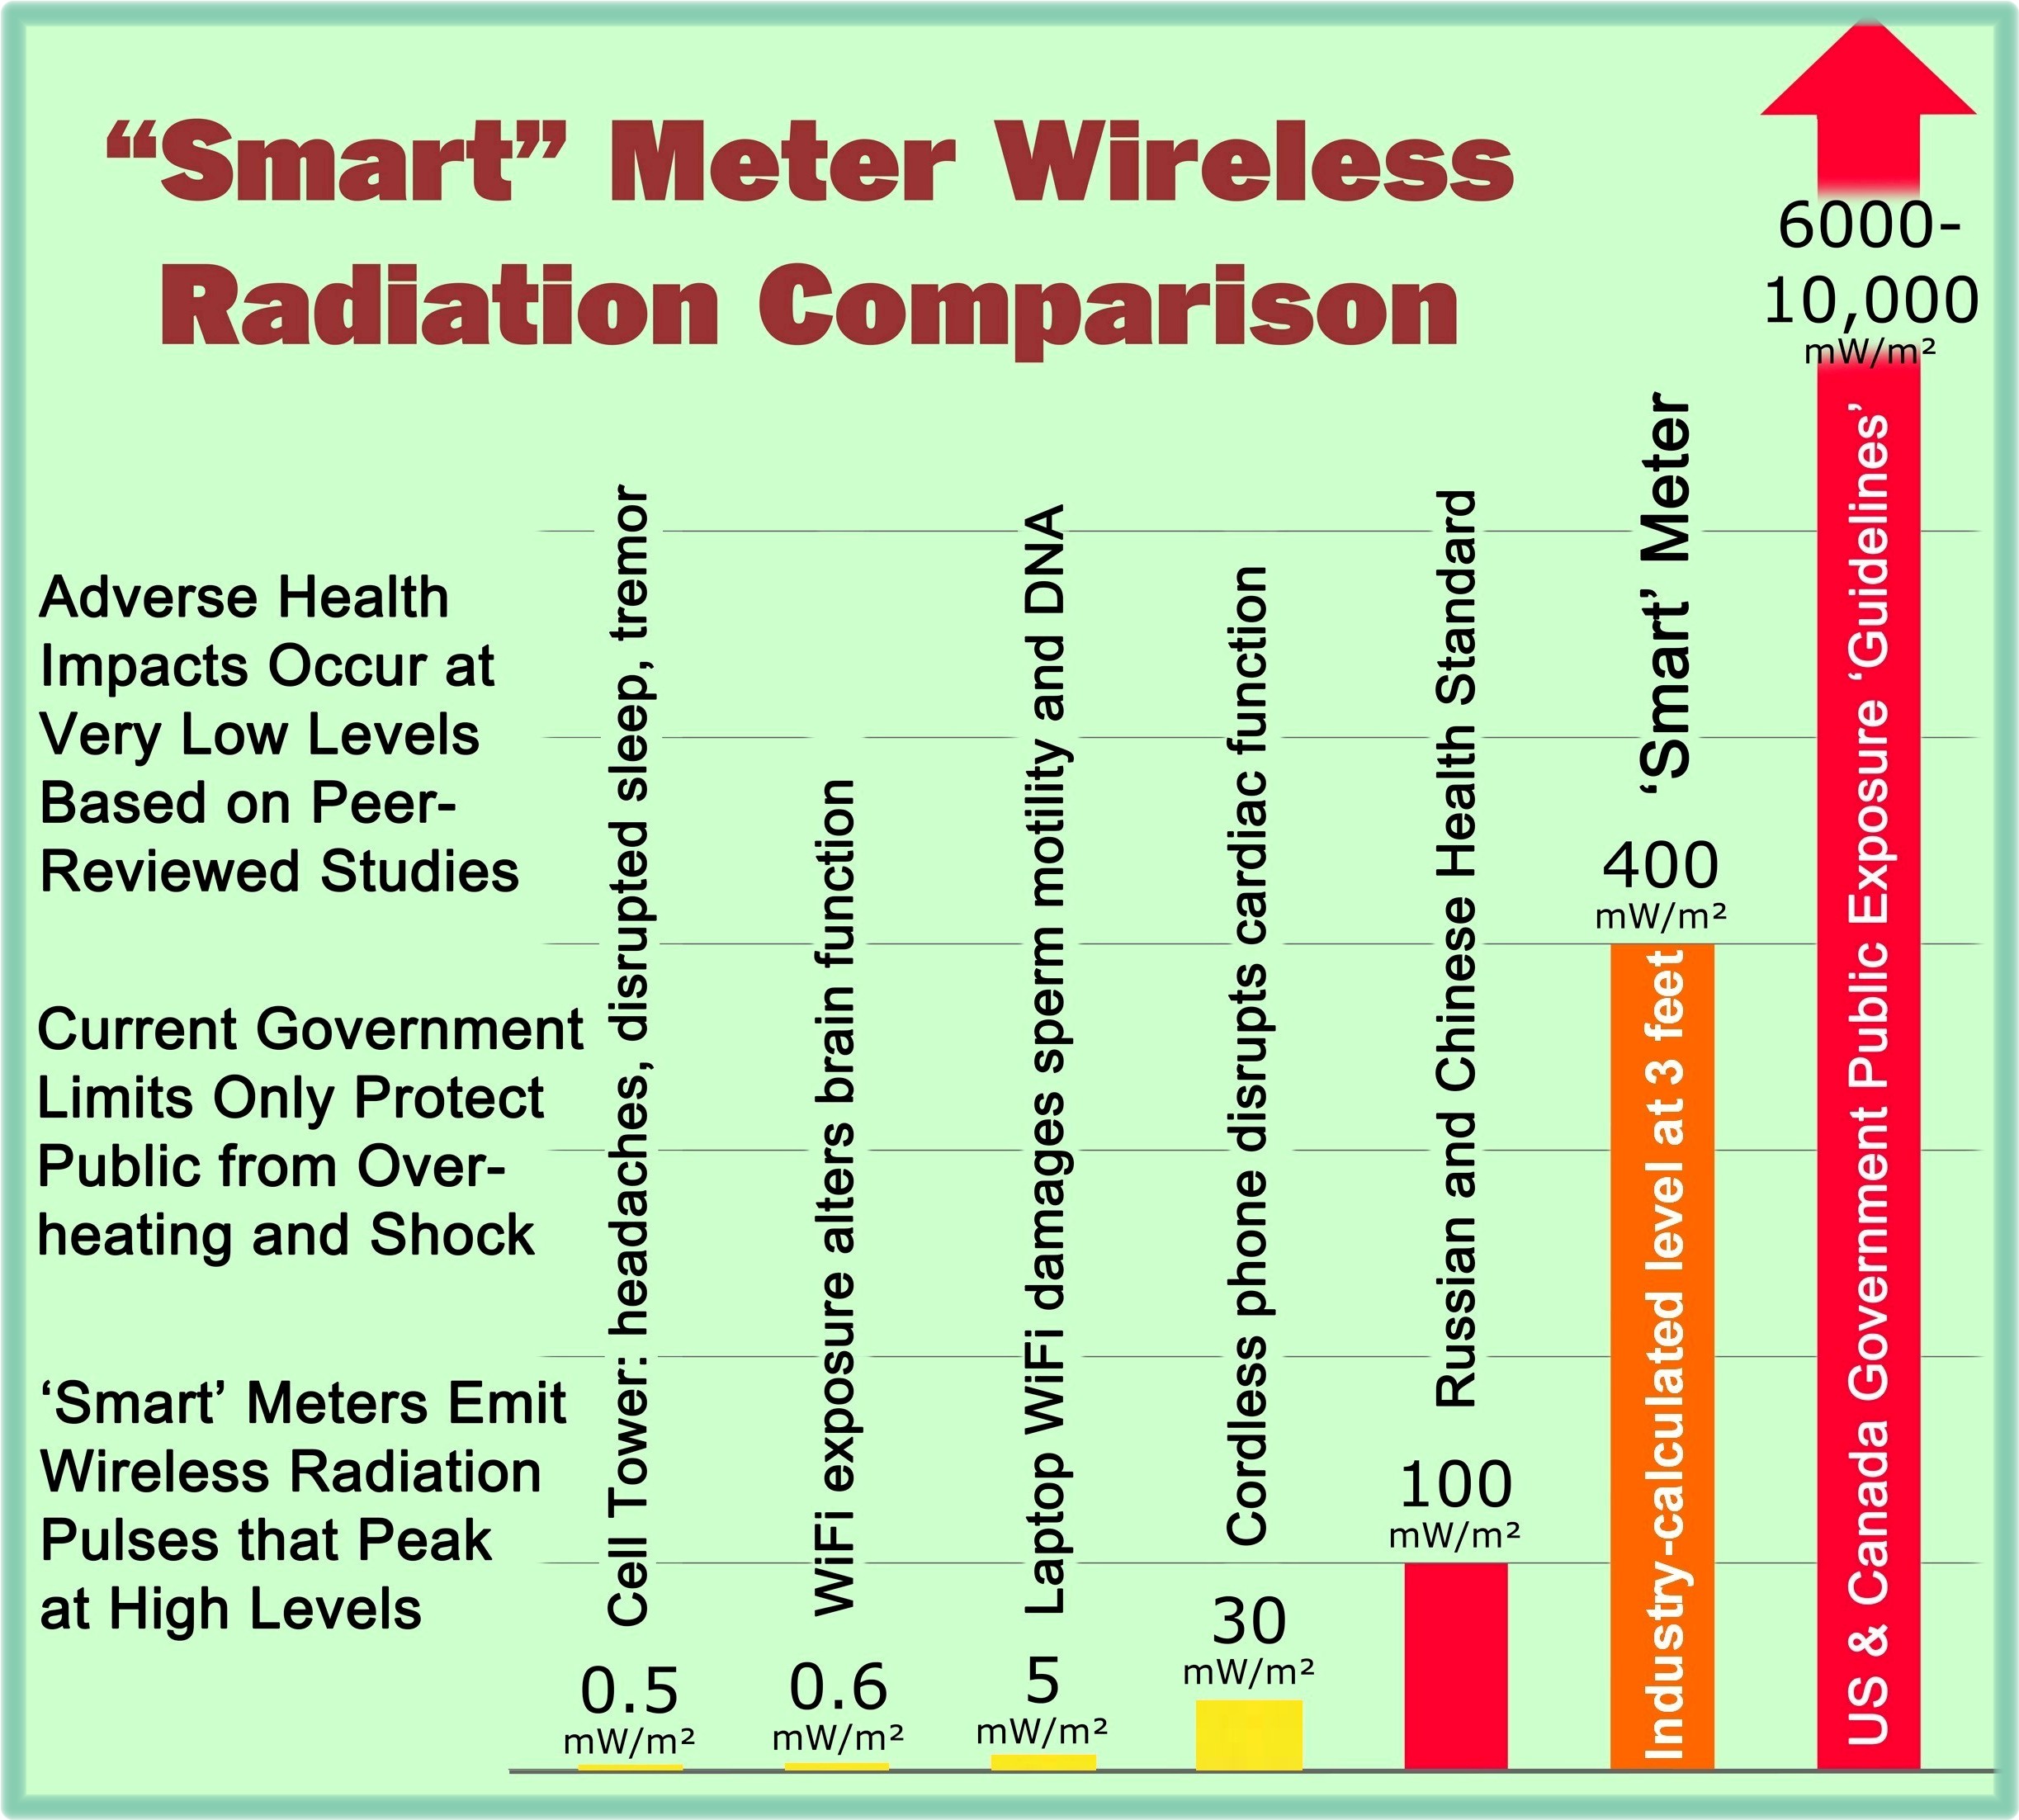
Based upon the above information, the ComEd RF Emissions Comparison chart could easily and more appropriately have been depicted with the smart meter being the highest value. [9][10] Of course that wouldn’t have fit the narrative that smart meters are “low-power.”
Although the ComEd chart is deceptive, the language in the “fact sheet” is cleverly worded from a legal perspective to account for any issues:
“The RF exposure a person might encounter from a smart meter in a typical household setting can be significantly less than the RF signals they are exposed to from common, electronic devices found within the home.” [emphasis added]
So the exposure from a smart meter “can be” less than other devices, not that it will be. Also, no mention is made by ComEd that other so-called “common, electronic devices found within the home” are voluntary in terms of purchase and use. Some people for various reasons choose not to purchase them.
In another location the ComEd “Fact Sheet” states that:
“Although smart meters use radio technology, under typical circumstances a person would receive significantly less RF exposure from a smart meter than from many other electronic devices…” [emphasis added]
Here again, with language no doubt approved by a corporate attorney, a scenario is acknowledged that allows the possibility for atypical circumstances where a person could receive the same or more exposure from a smart meter as compared with other common electronic devices. How reassuring is that?
Compliance with Federal Exposure Guidelines
The ComEd “Fact Sheet” also mentions in several different ways that RF emissions from smart meters comply with Federal guidelines, e.g.,
“Our smart meters comply fully with Federal Communications Commission (FCC) health and safety standards and emit RF signals far weaker than the levels permitted by the FCC.”
The above statement is meaningless to those consumers concerned with chronic RF exposure effects. To substantiate this, I will quote a respected scientist, David L. McCormick, Ph.D., who was a member of the Working Group for the International Agency for Research on Cancer (IARC) and who voted to declare RF radiation as a possible carcinogen in 2011:
“One of the challenges with dealing with possible health effects of RF fields is that the device manufacturers say, ‘Well, our device, be it a phone or whatever, meets all FCC requirements’. In terms of potential long-term health effects, that’s a completely meaningless statement.
Why? Because the FCC regulations were driven by thermal effects, by tissue heating. We know that any long-term effects of magnetic fields are going to result from effects that occur at non-thermal temperatures where there is not obvious tissue heating.
So the fact you are below a thermal level says nothing about whether or not there is any risk associated with that exposure.” [11]
.
Consideration of Factors Dealing with the Nature of the RF Radiation
The wireless industry, ComEd, and other utilities incessantly focus on the intensity of the radiation emissions for smart grid components and then perform a simple comparison of those values with thermally based exposure guidelines. But for chronic RF-related exposure effects, other factors play an important role, such as the nature of the signal itself, e.g., whether the RF waves are continuous, pulsed, or modulated in nature.
A recently published study demonstrates how RF biological effects can actually occur or be induced independent of the “amount” or intensity of RF exposure. Based upon the results of a study titled, “Tumor Promotion by Exposure to Radiofrequency Electromagnetic Fields Below Exposure Limits for Humans,” tumor production was induced where no clear dose response effect was noted, i.e., exposure at low levels was just as likely to produce tumors as at higher levels. What was particularly important about this study was that it was a “replication study” and where the authors stated:
- Tumor-promoting effects of RF-EMF exposed mice have been [previously] reported in 2010.
- We have replicated the study with higher numbers of mice per group.
- We could fully confirm the previous results, thus the effects are reproducible.
- Apparently, no clear dose-response relationship is evident. [12]

Analysis
Based upon the information presented in this article, it can be deduced that ComEd (as do other smart grid proponents) exaggerate the RF output values for common RF emitters such as cell phones and microwaves by the way they present the information to consumers. ComEd and other smart grid advocates also blindly accept the FCC exposure guidelines as adequate to protect for all exposure scenarios and ignore that RF power output and intensity are not the only parameters of interest in assessing possible health risks to the public.
There are still many unknown factors related to the health risks associated with long-term exposure to RF emissions. Unfortunately, the wireless industry, the smart grid industry, and the Federal Communications Commission do not endorse the concept of “precaution” in order to eliminate unnecessary RF exposure from our daily lives. Thus, currently, it has fallen upon concerned and informed consumers to do what they can to eliminate such exposure sources. As a matter of principle, consumers certainly deserve the right to prudently limit or eliminate sources of RF radiation exposure, such as smart meters, that might be installed on their own property … and to do so without penalty or cost.
References and Notes
- ComEd “Radio Frequency Fact Sheet,” available for download at: http://wp.me/a3nav9-2ZK.
- “Health Impacts of Radio Frequency Exposure from Smart Meters,” California Council for Science and Technology (CCST), Final Report, dated April 2011. The document is available at the following link: www.ccst.us/publications/2011/2011smart-final.pdf.
- Refer to EPRI Document # 1022270, “Radio-Frequency Exposure Levels from Smart Meters: A Case Study of One Model,” February 2011. EPRI stands for the Electric Power Research Institute. For the 250 mW value, refer to footnote 1 of Table 1. The document is available at the following link: http://wp.me/a3nav9-2ZL.
- “Comments from the Telecommunications Industry Association,” dated September 3, 2013, submitted to the Federal Communications Commission (FCC); ET Docket Numbers 13-84 and 03-137; refer to page 20 of the correspondence for the reference to the average power output of mobile phones.
- Persson, T., Törnevik, C., Larsson, L.-E. and Lovén, J. (2012), “Output Power Distributions of Terminals in a 3G Mobile Communication Network,” Bioelectromagnetics, 33: 320–325; abstract available at
http://www.ncbi.nlm.nih.gov/pubmed/22012866.
- To supplement the evidence presented by References [4] and [5] above, a review of “US Wireless Carrier Metrics,” for the fourth quarter of 2012 revealed that nearly 60% of US cellular phones operate with CDMA (Code Division Multiple Access) technology. In an article published in 2011 [citation below], power output values for CDMA phones and other phone types were reported under various conditions, i.e., rural, suburban, and urban. In this study, there were 92 uses or trips for phones that employed CDMA technology. The study was conducted within the state of California. For the 92 trials, the overall average RF power output was -0.38 dBm or 0.92 milliwatts (approximately 1 milliwatt). Thus, the average power output of 1 milliwatt from an additional published study for phones using CDMA technology in the United States is further supportive of using this power output value in model calculations as a valid operational scenario for cellular phone use in the United States. [Citation: “Measured Radiofrequency Exposure during Various Mobile-Phone Use Scenarios,” by Kelsh MA, Shum M, Sheppard AR, et al., Journal of Exposure Science and Environmental Epidemiology, 2011 Jul-Aug;21(4):343-54; abstract available at
http://www.ncbi.nlm.nih.gov/pubmed/20551994.]
- Table 1 of Reference [3], EPRI Document # 1022270, lists 5000 microwatts per cm2 at 2 inches as one RF emissions strength value for a microwave oven. This in turn is the allowable (“safety design”) leakage rate for a microwave oven mentioned in the ICNIRP 2009 document listed in footnote 3 of Table 1 of the EPRI document. Reference [3] does not specifically list an RF value at a distance of one (1) foot from the microwave oven, and thus the 800 microwatts per cm2 value is likely an estimate of what the expected leakage would be at that distance given the allowed leakage at 2 inches. One can assume, for example, that leakage from of a microwave oven along one side of a door can be modeled as a line source. Doing this, one can show that a power density value of 5000 microwatts per cm2 at 2 inches should drop to approximately 800 microwatts per cm2 at 12 inches.
- Refer to page 10 of EPRI Document 1022270, “Radio-Frequency Exposure Levels from Smart Meters: A Case Study of One Model,” for the conclusion that smart meters RF emission levels are at levels similar to those that are present from other common RF sources. The link for the document is listed in Reference [3] above.
- For the smart meter to be plotted as the highest value on the ComEd RF Emissions Comparison chart, it would be more appropriate to label the y-axis as something like “Typical RF Signal Strength during Use.”
- In reality, it should be more fully appreciated that the original source information for the CCST and the “adapted” ComEd RF emission comparison charts consisted of a table (not a chart) of various RF sources with several columns as listed in the EPRI document listed in Reference [3]. It was never appropriate to graph the information from the EPRI table because you cannot do so without omitting much of the qualifying details. The table below is a close facsimile of the original EPRI table.
 As you can see, a simple chart or graph cannot visibly portray in an appropriate manner that the cell phone exposure is limited to the duration of a phone call or that the cell phone exposure is characterized as “highly localized” to the ear, while exposure to a smart meter can potentially become a source of chronic exposure to a larger portion of the whole body. Therefore, the very creation of these graphs by the CCST, ComEd, and other smart grid advocates was a convenient means for developing a propaganda-like message for consumers.
- Excerpt from lecture of David L. McCormick, Ph.D., “Cell Phones & Cancer Risk – Sokol Lecture Fall 2013,” full lecture available at: https://www.youtube.com/watch?v=OF7v2Ce2x5c&feature=player_embedded.
- Refer to the SkyVision Solutions blog article “RF Fields Promote Tumors Below Human Exposure Limits,” which discusses the content and conclusions of the published paper, “Tumor Promotion by Exposure to Radiofrequency Electromagnetic Fields Below Exposure Limits for Humans”; by A. Lerchl, M. Klose, K. Grote, A.F.X. Wilhelm, O. Spathmann, T. Fiedler, J. Streckert, V. Hansen, M. Clemens, Biochemical and Biophysical Research Communications (2015), doi: 10.1016/j.bbrc.2015.02.151.


Pingback: Thorner: Beware of propaganda to quell inconvenient truths about Smart Meters – Part 1 | Nancy J. Thorner
Great and very exhaustive work. As usual the ComEd chart is not at ear distance so the people are left confused for the utilities benefit.