by K.T. Weaver, SkyVision Solutions, Originally Published August 2014, Last Updated May 2019
 In recent years there have been public concerns voiced regarding radiofrequency (RF) emissions from wireless utility “smart” meters and that they could cause adverse health impacts. Unfortunately, no human health impact studies were conducted prior to the deployment of RF emitting smart grid technologies, which include the smart meters themselves as well as the associated gatekeepers and routers that are part of the overall mesh communications network for each utility’s smart grid system.
In the absence of health impact studies conducted prior to smart meter deployment by utility companies, equipment manufacturers, or health agencies, there have been myriads of anecdotal reports of adverse effects caused by smart meter emissions. In addition, there have been at least limited studies (as listed below) subsequent to smart meter deployments indicating ill-effects:
- “Symptoms Resulting from Exposure to Radiofrequency/Microwave Radiation from Smart Meters,” an article written by Ronald M. Powell, Ph.D. summarizing the results of a health effects survey conducted by Richard H. Conrad, Ph.D.;
- “Wireless Utility Meter Safety Impacts Survey,” by Ed Halteman, Ph.D., dated September 13, 2011;
- “Self-Reporting of Symptom Development from Exposure to Wireless Smart Meters’ Radiofrequency Fields in Victoria,” a case series by Dr. Federica Lamech, MBBS, and described by the American Academy of Environmental Medicine (AAEM) in a document called, “Wireless Smart Meter Case Studies.” [Update: In November 2014, the Lamech case series was published in a peer-reviewed journal. Refer to the following link for more details: “Published Article: Symptom Development from Exposure to Wireless Smart Meters.”]
- For a good summary document reviewing the last two studies listed above, refer to the following link for a paper prepared by Ronald M. Powell, Ph.D.: Symptoms after Exposure to Smart Meter Radiation.
Peer-reviewed studies as outlined in the BioInitiative Report 2012 support an assertion that adverse biological effects should be expected based upon the RF radiation levels produced from wireless smart meters. For information on published studies showing biological effects from RF exposure from various emission sources, one can review summary information charts contained within The BioInitiative Report 2012, and specifically, relevant charts available at the following link: BioInitiative Report Color Charts for Reported Biological Effects.
Additional support for the claim that adverse effects can be expected from wireless emissions from smart meters can be found in a paper prepared by Ronald M. Powell, Ph.D. at the following link:
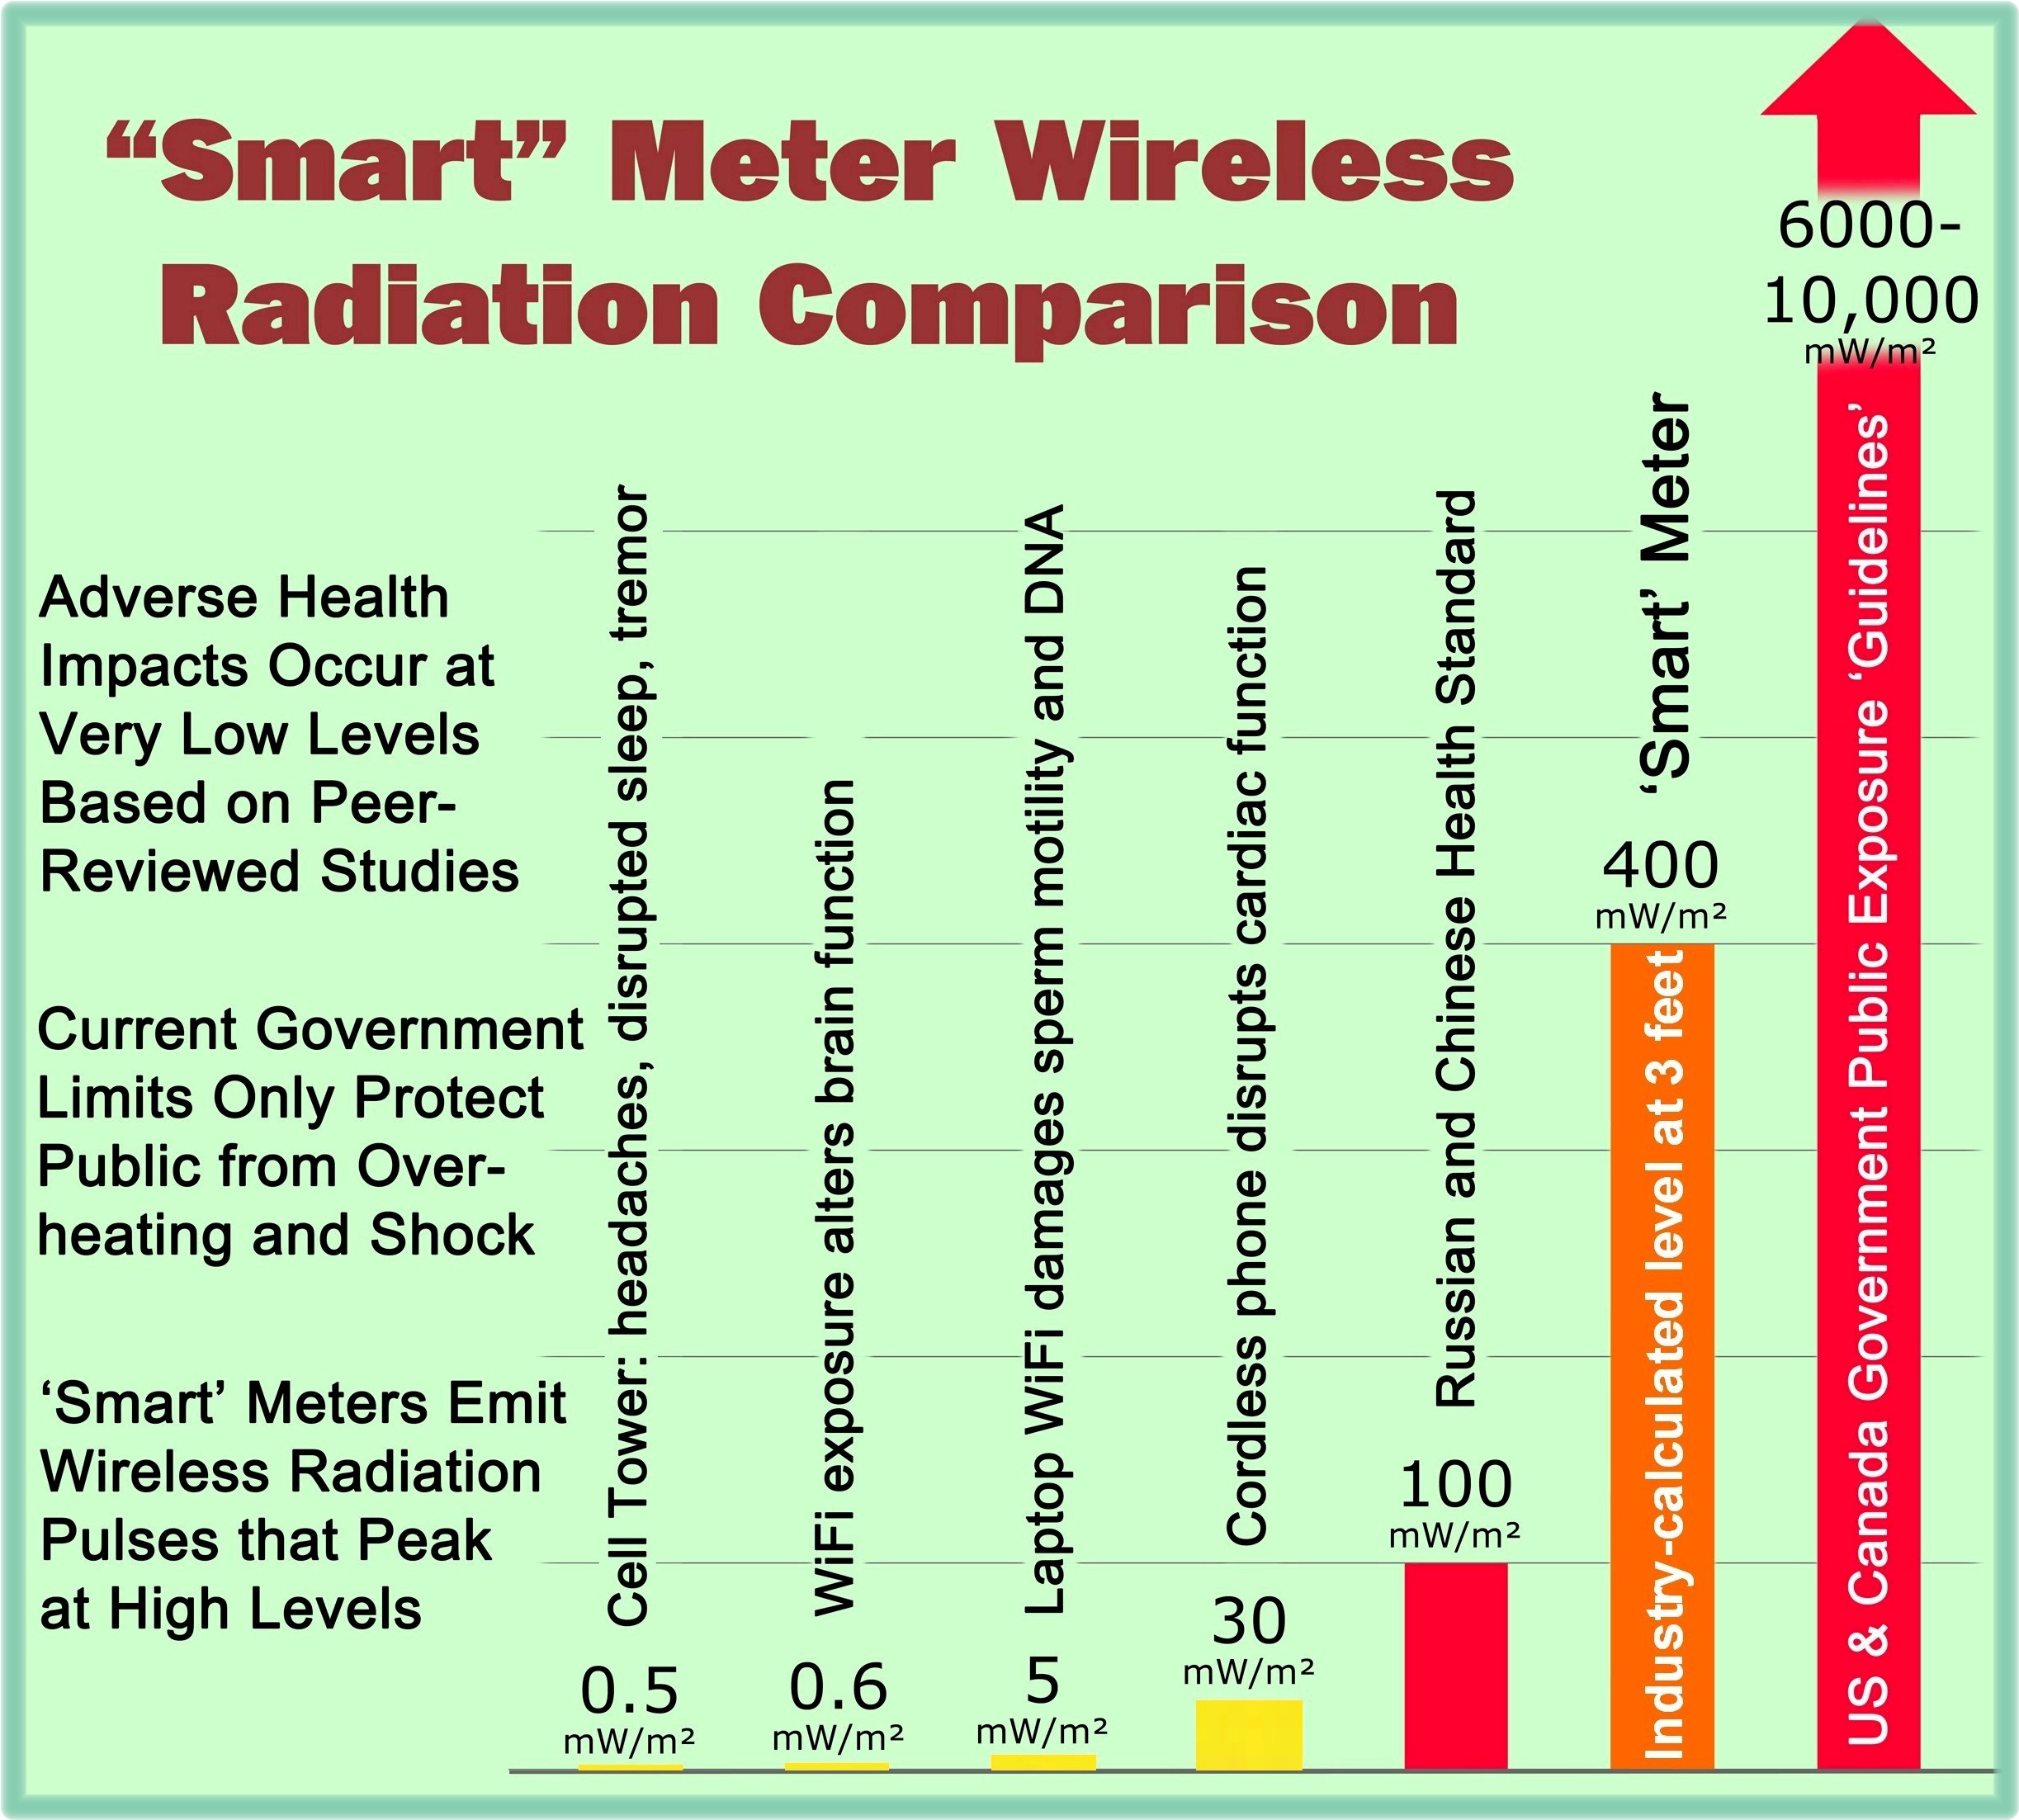
To more effectively communicate with the public on this topic, a chart has been prepared (as shown below) to compare:
- Possible levels of radiofrequency (RF) radiation emitted from wireless smart meters;
- Bioeffects and adverse health impacts that have been measured “at very low levels” based upon published studies from various emission sources; and
- Various governmental RF exposure guidelines that do not fully protect public health. In particular, the guidelines for the USA and Canada were only established to protect tissues from significant overheating and electric shock.
 Chart Colors updated October 14, 2018; One objective of the above chart is to provide representative data points as to how low (in terms of power density RF levels) bioeffects and adverse health impacts have been measured based upon published studies. A second objective of the chart is then to show that health impacts can be expected at RF levels well below those emitted by smart meters and established exposure guidelines of selected countries. Some visitors to this webpage, without understanding the above context, have interpreted the published study results (now represented in yellow on the chart instead of red) as simply typical power density levels of cell phones/towers, WiFi, and cordless phones rather than the levels that published studies have shown adverse effects. It is hoped that new color coding of chart values will help eliminate confusion and better communicate that some values on the chart have a different context than others.
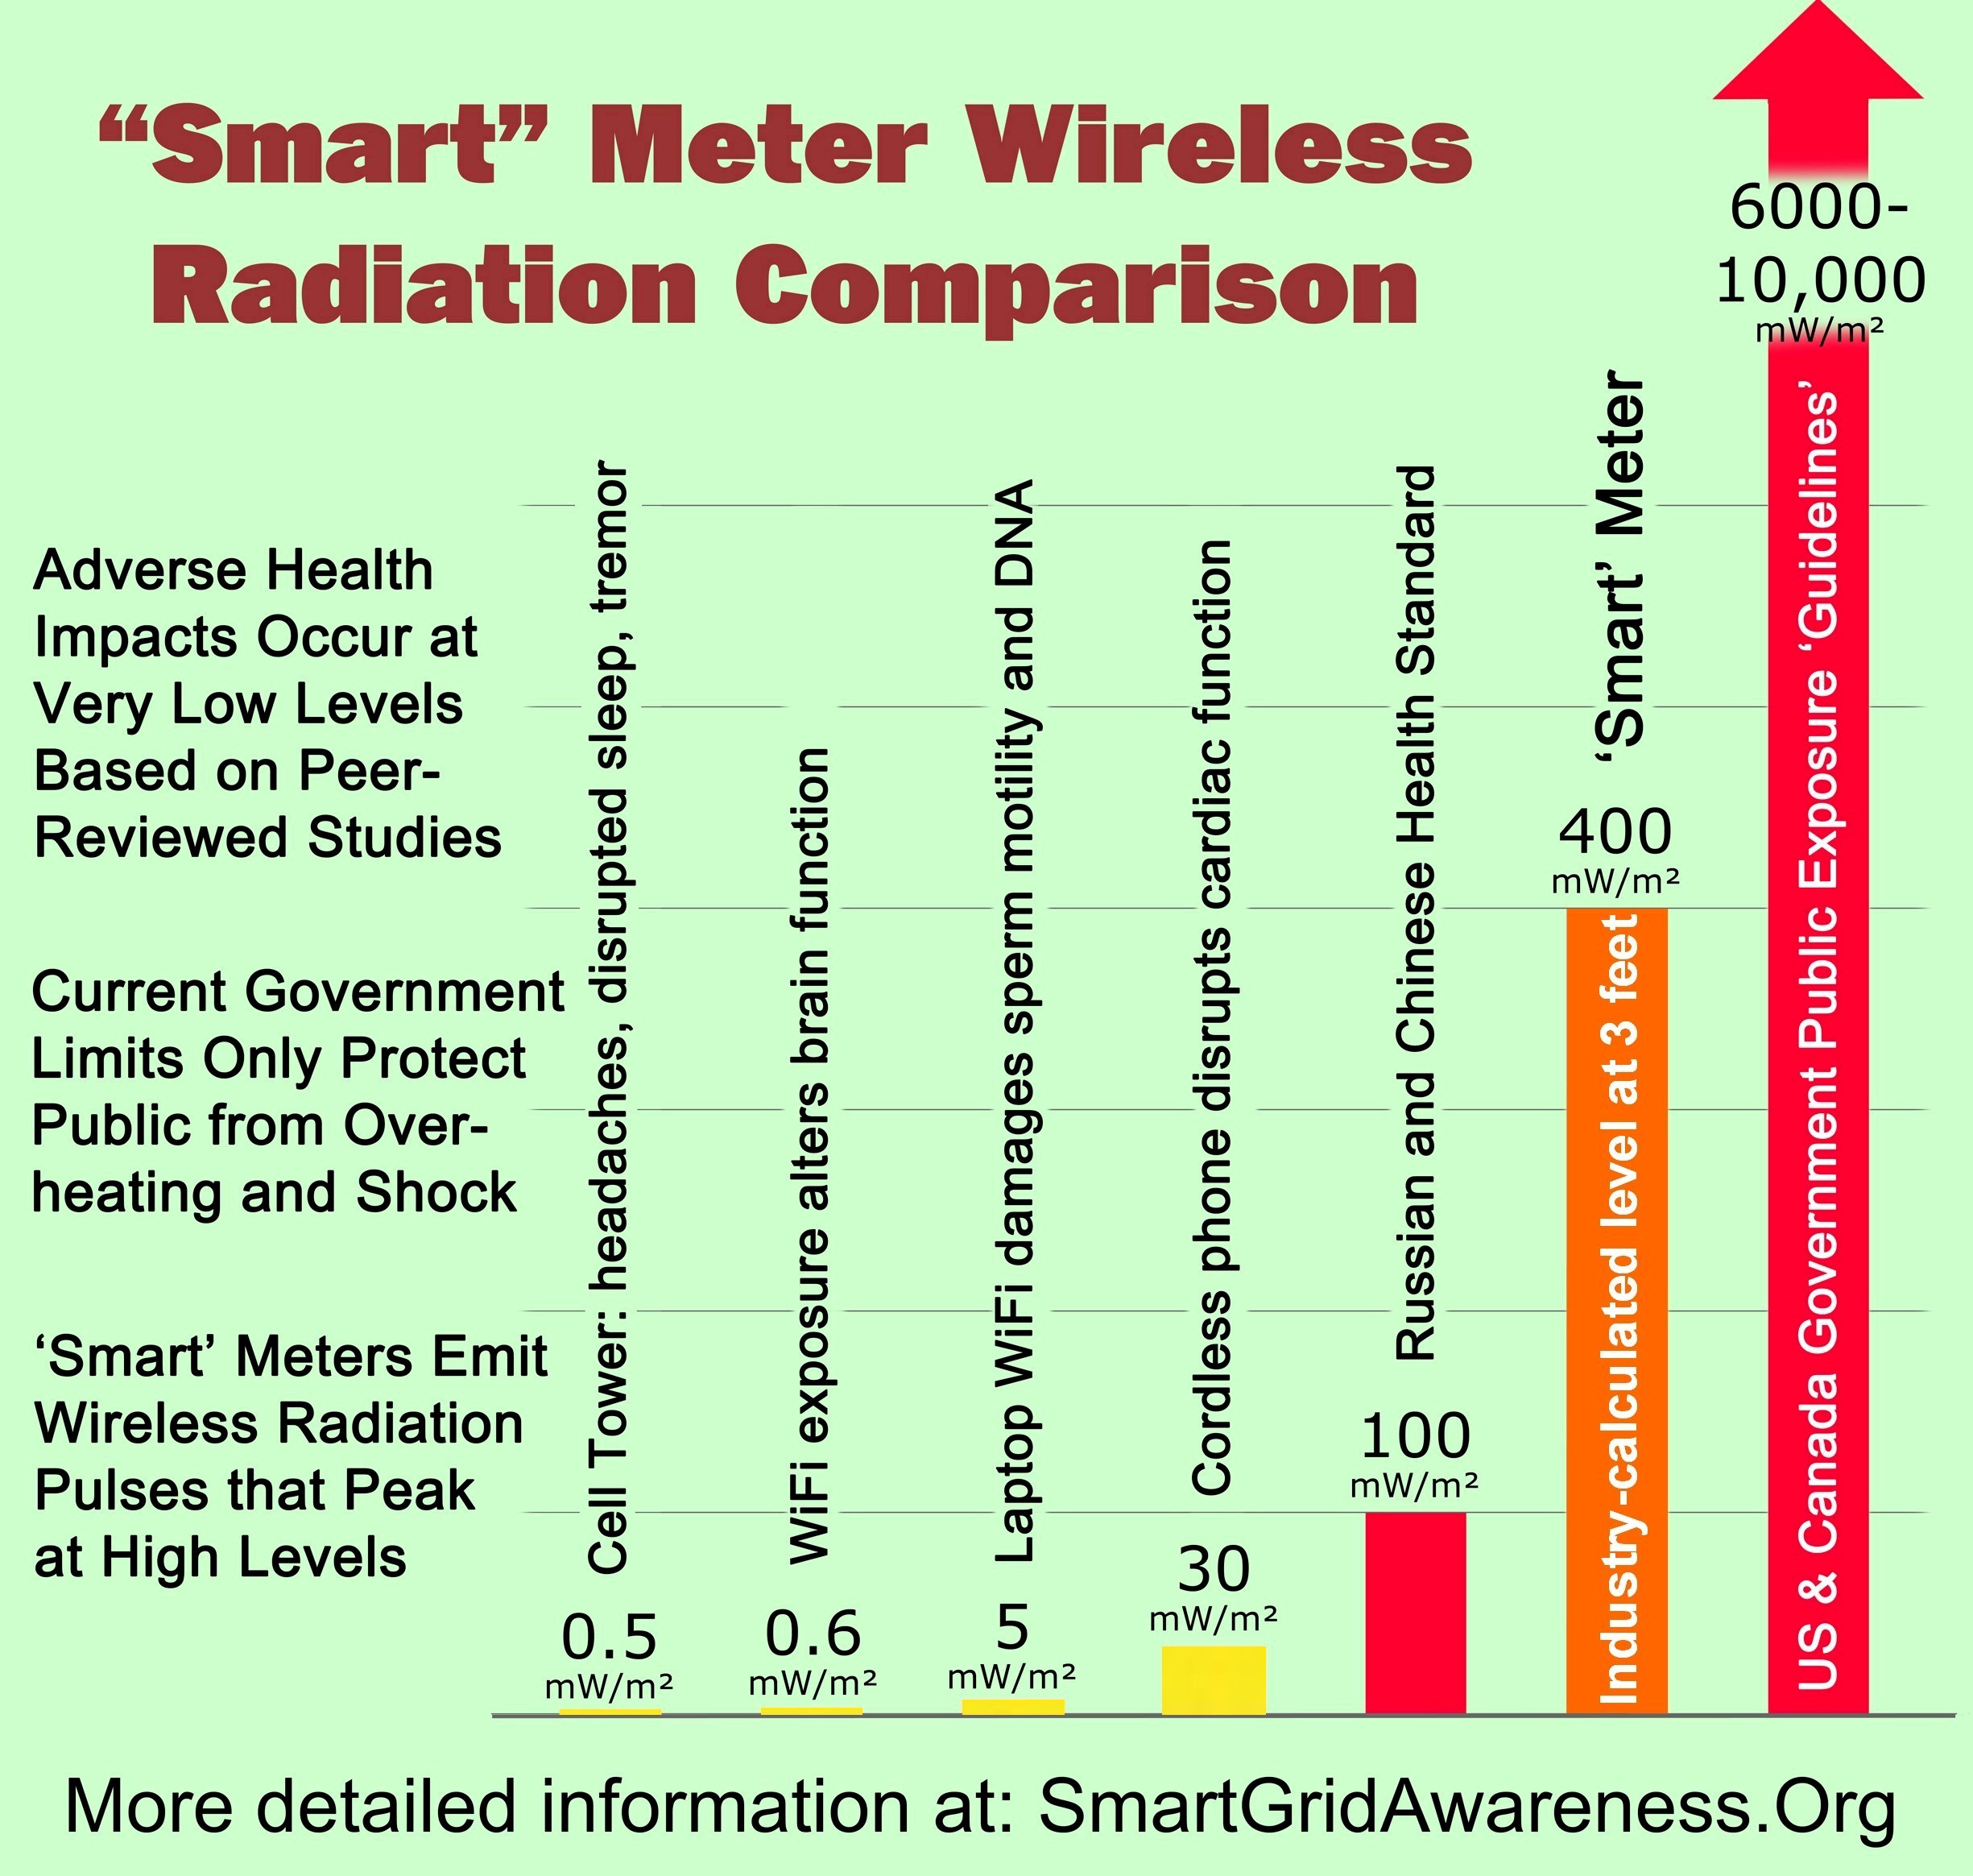
The above chart was developed in cooperation with Stop Smart Meters!
The vertical axis of the above chart represents an RF power density for each displayed parameter. The units of measure selected for the vertical axis are milliwatts per square meter (mW/m2). The selected units for the vertical axis work well for relating the RF power density shown to the total RF power that an adult human might receive. The surface area of an adult (male) human is about 2 square meters (m2). So the surface area that an adult human presents to an RF wave arriving from the front, or from the back, is about 1 square meter (m2). One (1) milliwatt (mW) is one-thousandth of a watt.
Thus, when an adult human faces an oncoming wave of radiation with a power density of, say, 10 milliwatts per square meter (mW/m2), that human will receive a total of 10 milliwatts (mW) of radiation over the entire body. That is, the number describing the power density will be the same as the number describing the total power received, even though the units of measure are different in the two cases.
Descriptive terms used on the above chart are somewhat simplified for purposes of conveying information to the reader in an easy way and getting everything to fit on one chart. More complete reference information is provided below.
Somewhat expanded basis information for the above chart values is provided in the linked PDF document shown below.
The information presented on this webpage establishes at least the plausibility of adverse health impacts being caused by wireless smart meters. Certainly there is an “association” of reported adverse health impacts versus wireless smart meter emissions (and with emissions from others types of wireless devices). But it is difficult to show “causation” due to most of the reported health impacts being anecdotal in nature and where other confounding factors cannot be ruled out.
RF Power Density Comparison Levels – April 2015
Power density is likely just one parameter which may be used as a measure for predicting adverse health effects due to exposure to RF emissions. Published studies have shown that other characteristics such as the intermittence and modulation of the RF signal, as well as the overall duration of exposure (i.e., short-term vs. chronic) also play a role.
Additional Technical Perspective on Wireless “Smart” Meter Radiation Levels
(for those interested in more technical details)
As mentioned above, the smart meter radiation level delineated in the chart is a value calculated based upon a modeled scenario described in EPRI Document # 1022270, “Radio-Frequency Exposure Levels from Smart Meters: A Case Study of One Model,” February 2011. The value of 40 µwatts/cm2 (or 400 mW/m2) at three (3) feet in front of the smart meter should be valid for the model of smart meter analyzed in the EPRI document. Technically speaking, the 400 mW/m2 represents the RF power density value during signal transmission where wireless smart meters generally transmit that signal intermittently over time.
It is not expected that the 400 mW/m2 RF radiation level would represent the typical exposure level for residents in homes where smart meters are normally mounted external to the home or when people spend most of their time at distances greater than three (3) feet from their smart meter.
Based upon a technical review of available reference documentation and test results, SkyVision Solutions would generally state that a typical maximum indoor RF level associated with wireless smart meters would be about 10 mW/m2. The point of this explanation is that, based upon information presented below, it should not be considered uncommon to find RF measured values in homes in the range of 1 to 10 mW/m2 or slightly greater than that range. In fact, if you are in a room of a home with a smart meter on the other side of one of the room walls, the likelihood can be quite high that exposure levels will be within the range of 1 to 10 mW/m2. These values are still well in excess of levels found in published studies showing bioeffects and adverse health impacts for various RF emission sources.
 In some situations where a smart meter is not installed on the outside of a home or business but rather on an inside wall, then indoor RF levels may certainly exceed the “typical” maximum value mentioned above. In those instances, the expected RF levels would more closely compare to the value shown in the above “Smart” Meter Wireless Radiation Comparison chart.
Reference material presented below forms the basis for the perspective that the typical maximum indoor RF level associated with wireless smart meters would be about 10 mW/m2:
Review of Another EPRI Study
- A review was conducted of EPRI Report # 1021829, December 2011, “Characterization of Radio Frequency Emissions from Two Models of Wireless Smart Meters.” This report provides industry accepted values for two specific models of smart meters each containing a nominal 1 watt RF transmitter.
- Overall, ninety (90) to ninety-five (95) % of RF fields inside a home will be less than 10 mW/m2, based upon measurements for six California residences. [This means that 5 to 10% of RF field measurements inside a home may be equal to or somewhat above this level.]
- Refer to link at: http://www.epri.com/abstracts/Pages/ProductAbstract.aspx?ProductId=000000000001021829.
RF Exposure Numbers from Smart Grid Advocates
- Page 13 of a joint presentation by smart grid advocates before the Florida Public Service Commission (PSC) on September 20, 2012, states: “Typical indoor peak exposure < 1 uW/cm2” (or 10 mW/m2)
- Refer to page 13 at link: https://smartgridawareness.org/wp-content/uploads/2014/06/fl-psc-joint-iou-presentation-on-smart-meters.pdf.
Review of a Richard Tell Study
- In situations where the nominal RF transmitter output is in the range of 200 to 300 milliwatts as is the case in the Richard Tell study within the state of Vermont, then typical RF indoor maximum RF levels would appear to be well less than 10 mW/m2. In the 2013 report published by Richard Tell Associates, there were 141 indoor residential measurements where the peak indoor measurement was approximately 5.0 mW/m2. Based upon information on page 45 of the Tell report, approximately 10% of the indoor measurements were greater than 0.6 mW/m2 (but yet less than or equal to 5.0 mW/m2).
- Reference: Page 45 at: https://smartgridawareness.org/wp-content/uploads/2014/01/vermont-dps-smart-meter-measurement-report-final.pdf.
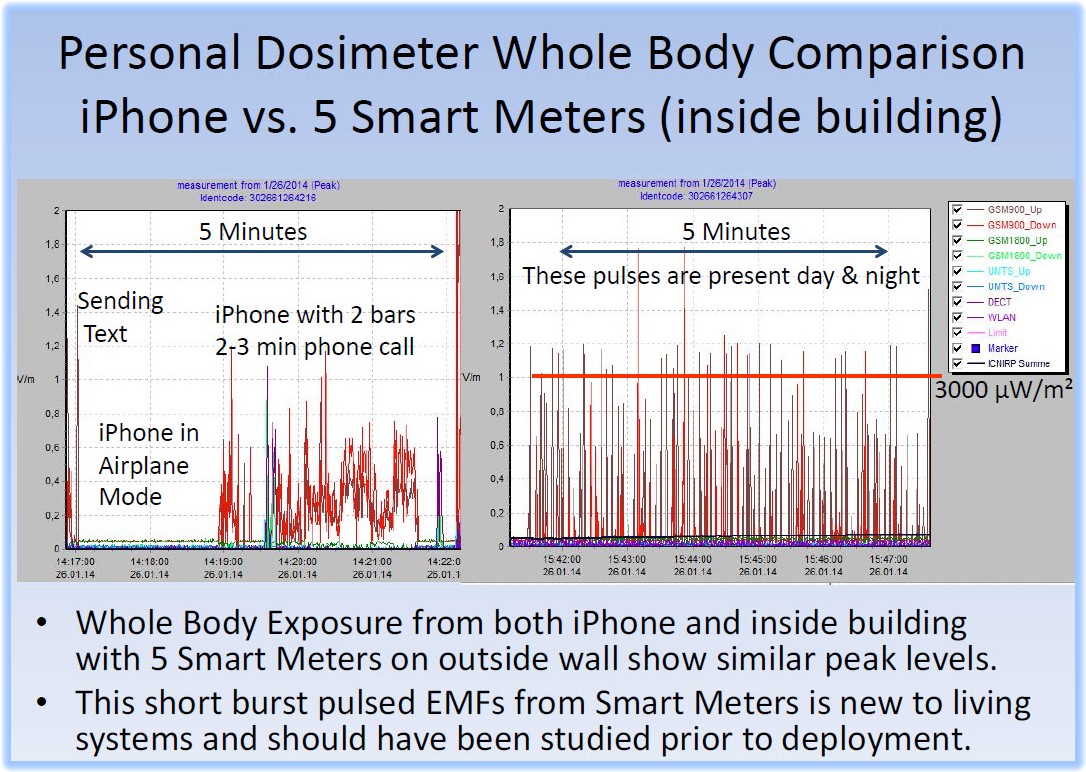
Indoor Smart Meter Measurements by Dr. Karl Maret
Dr. Karl Maret performed smart meter-related measurements early in 2014 where he found RF radiation power density measurements with frequent pulses in the range between 2 to 4 mW/m2. These measurements were performed inside a building where five (5) smart meters were located outside the building. Refer to the figure below which is a slide selected from the following file: Maret.Presentation.January 2014.
Modeled Exposure Levels for an Actual Home
- Note that in an actual home, where a smart meter faced toward a bedroom wall, calculated exposure levels in the bedroom were expected to be 5 mW/m2 at a distance of two (2) meters from a smart meter as discussed in a blog article at https://smartgridawareness.org/2013/09/20/smart-meter-home/. (Refer to home layout picture below.) A family member of the home’s occupant reported measured levels consistent with the values calculated by SkyVision Solutions although these values were not presented in the article because the peak measured levels were not formally documented.

Commonwealth Edison Indoor Smart Meter Measurement
Commonwealth Edison (ComEd) performed an indoor smart meter measurement as part of a YouTube video discussing RF concerns. This measurement was taken inside a utility customer’s kitchen and was indicated to be 910 µwatts/m2 or about 1 mW/m2. This measurement was said to have been verified by an independent third party. The video further stated that “placing a baby monitor about two feet from a transmitting baby monitor exposes the child to roughly the same RF emissions that one would receive in KC’s kitchen.” For further information regarding this video, refer to the link at: https://smartgridawareness.org/2014/01/22/comed-compares-smart-meters-to-baby-monitors/.

RF Characterization of a Landis & Gyr Smart Meter
In 2014, EPRI published an RF characterization of a Landis & Gyr smart meter, one of three different models used by CPS Energy in San Antonio, Texas. This smart meter had a power output of 1 watt. What was unique about the characterization was that power density values were plotted to create a “color map” providing a qualitative representation of actual measured data and in a manner that provides a three-dimensional perspective. Refer to the figure below. The figure indicates that RF levels are in the neighborhood of 45 mW/m2 at 1 meter in front of the smart meter. As you get to about 10 feet in front of the meter, the RF levels drop to about 10 mW/m2. You can see that the RF levels are not as intense to the sides and back side of the smart meter but still are in the neighborhood of 5 to 10 mW/m2 at about 1 meter behind the smart meter. Measurable RF levels would extend beyond the blue fringe area of the “color map,” but additional measurements were not plotted as part of this meter RF characterization.
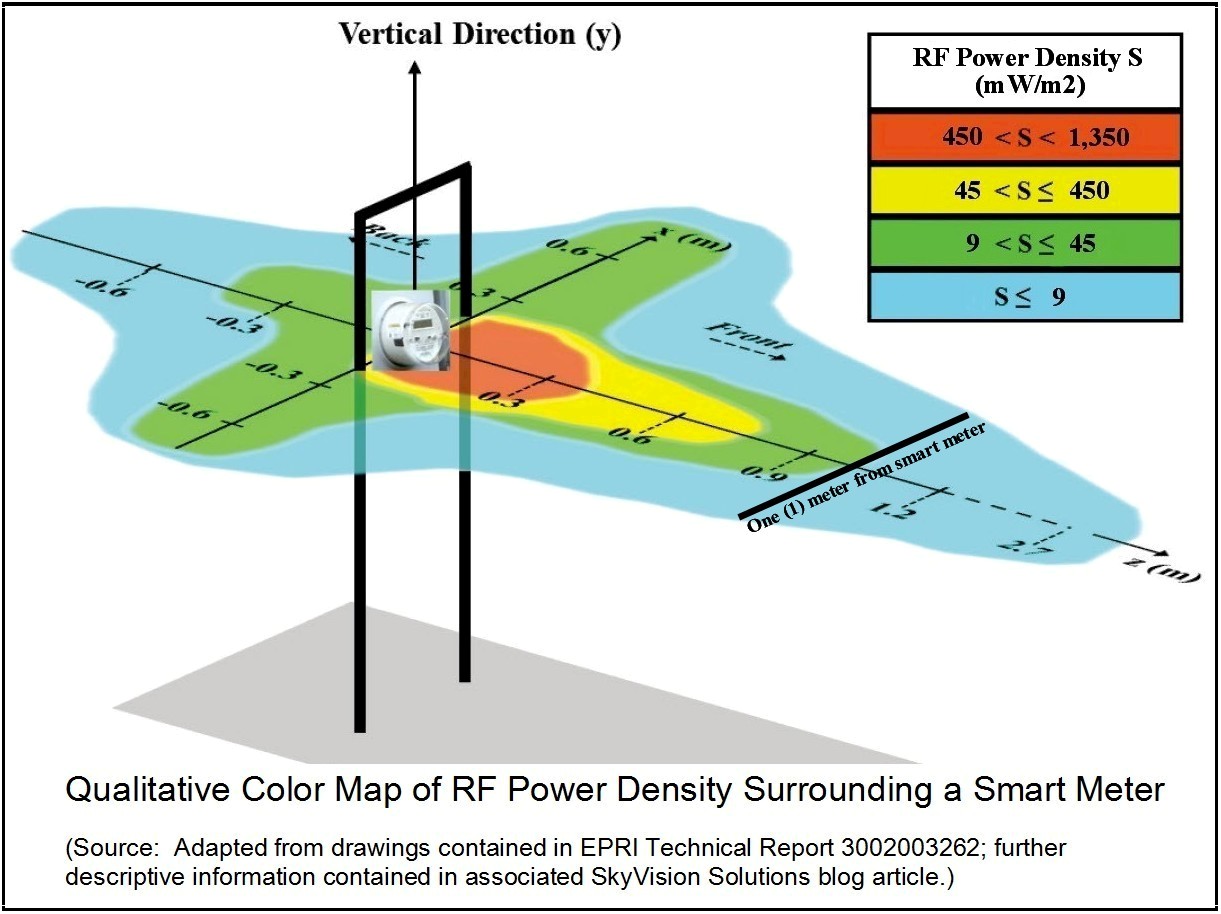 Referenced EPRI Report: “Characterization of Radio Emissions from Advanced Metering Infrastructure Revenue Meters (Smart Meters) in CPS Energy Residential Installations,” Electric Power Research Institute (EPRI), 2014 Technical Report. Please note that Figure C-2 of the EPRI report was used to better approximate mW/m2 values referenced above. SkyVision Solutions also converted ICNIRP reference levels as used in the report directly to power density values. The full EPRI report is available for review at
https://smartgridawareness.org/wp-content/uploads/2016/03/epri-report-on-cps-smart-meters-march-2014.pdf
Some content for this webpage was updated on May 18, 2019.
Note: The link address for this webpage was changed on April 18, 2019, in order to block hundreds of spam comments that were being submitted per day for this page. Apologies to others who may have referenced the original link address at their website.


Pingback: Detoxify Your Home: Living Areas - Wellness Via Design
Pingback: Smart Meter Wireless Radiation Comparison | Coalition to Stop Smart Meters in BC
I am aware that the inline contact breaker inside the plastic cased smart meter can arc between its contacts under a heavy load if a tiny amount of contact resistance occurs. This generates a lot of heat that can then ignite the plastic case. Once flames are established inside the meter, these will conduct electricity, making the fire explosive. These smart meters are often located under staircases, surrounded by flammable materials. Image this scenario at 3am, when the kids are sleeping upstairs? In large houses converted to flats, another ‘Grenfell’ is likely. I suggest all existing and future smart meters have the inline internal contact breaker removed. Many fires caused by the internal breaker have occurred, both here and in the States, but are usually ‘covered up’. This is not satisfactory, purely on domestic fire safety grounds, so what do you propose to do about this? Sincerely, David Hine
What would be the best way for me to test the radiation output from the Smartmeter on my home?
Something like a CORNET ED-88T EMF/RF Detector (or 88T Plus) is generally appropriate for consumer use. You should be able to find at Amazon or other sites. Really accurate measurements, however, are done by professional consultants or building biologists, possibly at considerable expense.
Thank you for the fast reply and help! I will look into the Cornet. I could not find any consultants nearby (in Michigan).
My provider claims their meter only sends out one text message per day via the cellular network, and I’m hoping to compare or see this myself.
Would like to see microwave ovens added to your chart. All the ovens I tested with my Acousticom 2 meter exceeded the meter’s capacity anywhere near the ovens. The exposure levels should have been included in your chart as most people stay in the room when using these ovens causing high exposure to rf microwave radiation. I leave the room when using my oven.
This chart is intended to show you RF levels that biological effects have been reported based upon published studies for various types of RF technology and then compares those levels with potential smart meter emission levels and federal guidelines. I am not aware of any published studies reporting health effects due to being exposed to microwave oven emissions that could have been quoted.
Pingback: Is the Wifi-Age Harming Our Dogs (and Ourselves)? | Oberhund
Pingback: Radiofrequency (RF) Radiation Power Density Levels for Smart Meters, Various Biological Effects, and Exposure Guidelines | Smart Meter News
Pingback: Analysis of CPS Energy “Smart” Meters Shows Radiation Pulses Occur 700 Times as Often as What CPS Says | Stop Smart Meters!
Addressing Daniel’s observational concerns: As fully grown beings, we are generally robust & can tolerate such radiation (around 3% cannot) but damage to human egg cell in young ladies will be amplified trillions of times in future generations following conception, with damage propagated from generation to generation with genocidal potential. The size of the human egg cell is trillions of time smaller than the fully grown human being, dna damage is therefore potentially magnified.
Can’t really say what the outcome of this uncontrolled experiment may be, but as an engineer/scientist we are familiar with the “precautionary principle”. This has gone out the window in this case.
Skyrocketing cancer rates combined with rates of infertility are just too obvious to ignore or deem an accidental or coincidental side-effect of the technologies and methods being pushed at an alarming and increasingly rapid rate here in the West.
What about a real-life situation? I mean, if you are in downtown Toronto, even without any smart-meters, we receive dozen of WiFi signals every second and dozen of cellphone signals through our body. Did it mean that we are already fxcked-up whether we have smart meters or not. OR it means that you collect the highest number of the [nastiest] device to make it look the worst … ?
Because, if I look at it, I receive exactly 22 WiFi signals (lot of neighbors) in my apartment and I live just in front of a big power line. Nobody is sick around me and nobody that I know have those alleged side effects, why? Are we aliens?
The purpose of this article was to focus mainly on smart meters but yes there are concerns with all devices that emit RF waves depending on the levels. Many people oppose smart meters because they have no choice in having the devices attached to their own homes. The exposure is chronic and thousands of people report illness due to exposure. In many cases the device is mounted directly on the opposite side of a bedroom wall. People who are aware of the problem do what they can to live with it or move.
With some RF emitting devices, people have some degree of control over exposure. I personally would never live within direct line of sight of a high voltage power line or a cell tower. The health issues are of two types. You may feel fine today but yet may have an increased risk of disease in the future from something like cancer. Then there are immediate short-term effects (that can become chronic) where you may not realize the cause as RF exposure. Are you sure nobody around you suffers from headaches for example? Studies have shown that people living within about 300 meters of a cell tower have more headaches. If you think these studies biased in some manner, then consider studies showing severe decline in bird productivity (nests with chicks) within a couple hundred meters of a cell tower. [Reports related to animals are of special value since in this case it can not be alleged that the effects are psychosomatic.]
Some people are more affected by RF waves than others. Like many illnesses, a subset of the population is more predisposed to being harmed. Consider yourself lucky if you feel perfectly well and not currently affected.
I am not saying that it’s totally safe, it’s just that… in big town like Toronto, Montreal, Vancouver and so on, every corner is populated with dozen or more RF signals since a couple of years now and it is only now that we hear from people with electrosensitivity, mainly in rural areas, btw. I just don’t understand why us, people living in big cities, doesn’t seems to be affected that much… we’ll see, i guess…
OK. Well, in some cases people are driven to the rural areas to cope the best they can. If you haven’t, possibly watch this short film (link below) and see what you think. The video is not presented as scientific evidence but does show how some people leave the cities and also how others are reluctant to talk about their illness; thus, there may be more people afflicted than you think.
Thanks, i have watch it, but at that level, I do think that it is a rare condition! I really don’t believe that for most of us this is unbearable. I mean, seriously, I got it, on some people it is a big problem, but I live in front of my computer with 2000 other people in a big video game studio in Toronto, we go to the gym, we keep ourselves in shape (not like 3 of the 4 people in this video that were not in an healthy condition at first), and, like I’ve said, I’ve never encounter any people with that severity of illness and we literally swim in radio waves all day long! I don’t doubt the illness is real, I doubt it could be a generalized issue. For some it is exposure to petroleum residues, for some it is lactose, for some it is just pollen that can cause grave reactions, It does not imply that governments are wrong with the level of security that they currently have. For all those people that can’t breathe when they are in contact with pollen, what should we do, kill all plants around their area? The problem is sad, but it seems to me it is the kind of shitty condition that would affect like 0,01% of people, sadly 😦
Well it was nice of you to look at the material; hopefully you will keep an open mind. I would mostly quibble at this point with your number of 0.01%. At the very end of the film it mentioned that scientists generally agree that about 2 to 3% suffer symptoms. Beyond that it is a matter of being precautionary for exposure of certain groups like babies and children where even the most skeptical scientists say they don’t really know if there may be long-term effects or not.
Mainly in reply to Daniel Stern: It is time to be honest about RF radiation’s damaging impacts. Do you feel x-rays causing harm? No. Do you feel RF causing harm? Not unless you have radiofrequency sickness, which simply means your body is reacting with oxidative stress and other biological responses to the interference from microwaves to cellular functions. And you feel the results.
If you care, however, about human health, then it is time to pay attention to the biological impacts, not only people experiencing symptoms. (EHS, meaning cardiac and neurological and other changes are documented without symptoms, as well). Anyhow, my point is the developing baby is our FUTURE. What level of microwave energy is known to be SAFE for the fetus? Well? Please view Dr. Devra Davis and other expert scientists and medical professionals at the medical symposium at C4ST to understand what damage is being done – that you do not feel (yet) – to future generations. A moral human reaction would be to begin precautionary action. In fact, a moral response to radiofrequency sickness is to create limits and white zones to reduce the suffering. What comes first, fun and convenience or human health and well-being? That is the ultimate question. Thanks. (and thanks SkyVision for taking a stand and caring)
Thanks for the new chart. Such a chart could be useful to help people understand the problem of smart meter impacts on their families which they cannot see or feel, but wears down their health nonetheless.
Bio-effects, of course, have been documented at much lower levels than in the chart. I just have to note this here for full awareness purposes. Have you seen the bio-effects list from reputable science beginning at .00000001 mW/m2 (.00001 µW/m2) at http://emfwise.com/tableofeffects.php? This is MUCH lower than even the studies you reference, which are more recent. Actually, you likely know that science has been showing bio-effects for decades but industry and government refuse to listen and take precautions… (as you probably know, Zory Glaser of U.S. military compiled such a list of studies in 1971, which can be sampled at the Magda Havas site).
It is interesting to know that some scientists have stated it is the “pulsed” nature of the RF that makes it biologically active, even more than how high or low the power density may be. Studies show that RF used for beneficial purposes AND RF that creates damage seem to both occur via activation of voltage gated calcium channels in the body. Therefore, saying that “lower” peak power density levels than the ones in the examples we cite would be okay may be not true.
Further comparisons on safety standards/limits worldwide are available at http://emfwise.com/emf-safety-standards.php
Thanks.
You make some good points. It is true that the bioeffect levels selected for the new chart were chosen somewhat conservatively to better withstand scrutiny, and there are published studies showing bioeffects at lower levels as you say. The specific value you mention in your comment is well below the precautionary action levels established in the BioInitiative Report 2012. For reference purposes, a study that was used to help form the basis for the BioInitiative Report 2012 precautionary action levels had a threshold bioeffect level of 0.06 mW/m2. This was a German study called “Changes of Clinically Important Neurotransmitters under the Influence of Modulated RF Fields – A Long-term Study under Real-life Conditions,” Buchner K, Eger H., Umwelt-Medizin-Gesellschaft (2011) 24(1): 44-57. Original study in German. For an English version of study, refer to: https://skyvisionsolutions.files.wordpress.com/2014/06/buchner-_-rimbach-study-2011_english.pdf. The editors of the BioInitiative Report then applied certain safety factors (for chronic exposure or exposure to children) to the 0.06 mW/m2 level to arrive at the BioInitiative 2012 Report precautionary action levels that range from 0.003 to 0.006 mW/m2.
Thank you. It is interesting to note that no one really knows how low one must go to prevent or avoid harm, including children/fetuses/electro-sensitive people. FCC itself states its allowed levels do not address children’s impacts. BioInitiative does what it can based on studies, but the actual reality may be that there is no safe level for fetal and child exposure, and electro-sensitive people. The culture will sink or swim based on the actual reality, and individuals who want or need safe places are out of luck. But one must try to improve things even if it is not enough for all. This is a collective situation, since individuals have NO power to control the radiation’s reach….thanks.
You wrote about industry and government refuse to listen and take precautions… Yet you are citing havas which her co-worker sell emf filters… Look first why so many studies are flawed… I can give you reference to studies which show improvment in cognition and in EEG readings after emf exposure…. I know there is much conflict of interest among industries but what I discover that there is also conflict of interest in second side davis and C4ST also spread too much fear and then selling books, option to donate, and how many of their articles are in emf protecion seller sites? You think they don’t get money from them? My opinion about emf hard to say because both site have flaws big flaws. In my country I’m toxicologist so I know how studies which shows effect can be easily performed to gets results. Good example your reference http://emfwise.com; aren’t they [selling] emf shielding? Also look at nutrition; they wrote to use caffeic acid did you know that has the same classification as phones 2B? He basically tells you to protect against 2B agent with other 2B agent. He also reference Russell Blaylock who claims that can heal alzheimer in his wellness report but why from his 20 year career is there not even one such case? Reference: http://www.emfwise.com/nutrition.php [Website editor somewhat shortened content of this comment for clarity]
Great post. Couple of questions/comments, looking at this from a skeptic’s point of view and with a view toward convincing the wider public.
1. Why aren’t standards other than U.S., China, and Russia in this chart? What Russia and China are doing isn’t going to convince many, due to the fraught nature of our relationship with these countries.
2. Why aren’t cell phones in this chart? That is the most commonly cited comparison. To leave it out makes it look like industry arguments are right–cell phones are worse. Whether they are or aren’t, it needs to be in there for that reason.
Thank you. I look forward to your reply.
Thanks for your comment/questions that provide an opportunity to explain in more detail how and why the new chart was prepared. Here is a response.
Response to Question 1
The chart was initially prepared at the request of StopSmartMeters! to be placed on a relatively small space on its revised informational brochure. Click link to download at http://stopsmartmeters.org/wp-content/uploads/2013/10/Are-They-Smart-for-You-v3.pdf. Considerable review and discussion transpired as to how much detail could be placed on the chart as well what information was most important to place on the chart and what to communicate to the public.
The primary objective of the chart is to provide representative data points as to how low (in terms of power density RF levels) bioeffects and adverse health impacts have been measured based upon published studies. It was the objective of the chart to then show that health impacts can be expected at levels well less than those emitted by smart meters and established exposure guidelines of selected countries.
Obviously the USA and Canada exposure guidelines are of interest. In addition, the Russian and Chinese public health standards have been established for a number of years, are science based, and are therefore well documented within each country’s respective regulatory system. A few other countries could be named with exposure guidelines less the USA and Canada but those guidelines are largely precautionary in nature and not as easily understood by SkyVision Solutions as to their regulatory or technical formulation. In any case, there simply wasn’t room on the chart as envisioned and the emphasis of the chart was intended to be a bit more on “effects” than “guidelines.”
Response to Question 2
RF levels from smart meters are measured in terms of power density levels, typically in units such as milliwatts/m2. Published studies were reviewed and selected for bioeffects from exposures to WiFi, cell phone base stations, and cordless phones (for cardiac effects) because those studies were documented in comparable units of measurement. Bioeffects that may be documented in published studies from exposure to cell phone devices are generally reported in terms of specific absorption rate or SAR in units of watts/kilogram. Health effects in those units could not be graphed on the same chart as smart meter radiation levels in mW/m2.
The typical industry chart of comparing apples and oranges of different device RF emission levels is quite frankly technical nonsense. That “industry” chart does not consider the differences between localized and whole body exposure nor the differences between chronic and intermittent exposures. Attempting to “correct” the “industry” chart for its inherent fallacies and inaccuracies can be done but involves making a number of assumptions that can also be subjected to criticism.
The new chart is thought to be more meaningful for people to be able to easily and simply see how adverse health effects (documented in peer-reviewed studies) can occur at “very low levels” as stated on the chart. … at levels lower than the exposure guidelines of the major countries of the world and at levels lower than smart meter emissions. Furthermore, the type of radiation emitted by cell phones is represented on the chart by way of listing health effects associated with cell phone base stations. People looking for more detail can always refer to the BioInitiative Report 2012 Color Charts and the paper prepared by Ronald Powell which are mentioned earlier on this web page.
Pingback: ‘Are They Smart for You?’ Brochure: Copies Now Available | Stop Smart Meters!