Introduction
When you want to promote the safety of a product, it is common to compare the relative safety of “your” product as compared with other similar products. Unfortunately, you are sometimes forced to compare “apples with oranges” in these endeavors and depending on your level of bias and the assumptions that you make, two different organizations can arrive at completely different versions of reality. Such is the case where the smart grid industry has compared smart meter radiofrequency (RF) emissions with those of other common wireless devices in use by our society. Usually the most extreme comparison made is between smart meter exposures and cell phone exposures. This blog posting (and the associated PDF file) will provide a detailed analysis of one such example comparison.

This blog posting will demonstrate, contrary to City of Naperville claims, that exposure to RF emissions from a smart meter over the course of a 24-hour period at distances of three (3) and ten (10) feet could easily exceed the exposure received from making a 3-minute cellular phone call.
It is also asserted that the analysis presented in this blog posting is significantly more appropriate (and objective) in terms of assessing potential health risks associated with smart meter exposures than anything you will find disseminated from smart grid industry sources.
City of Naperville Comparison Between Cell Phones and Smart Meters
The Public Utility Commission of Texas (PUCT) issued a report in December 2012 that purports to address concerns over the potential health effects of exposure to the radiofrequency emissions from the wireless technology of advanced metering. Page 43 of that report highlights the fact that the City of Naperville, Illinois, has issued a public relations flyer that states:
“…a person sitting 10 feet in front of their smart meter would have to be there for more than 100 years to receive the same RF energy that they would receive from a 3-minute cell phone call. If a person were sitting inside their home 3 feet from the back of a smart meter, they would have to be there for more than 200 years to receive the same RF energy as they would from a 3-minute cell phone call.”
Additionally, the City of Naperville documents assumptions in footnotes as follows:
- Smart Meter Specification: duty cycle of 0.1%; 250 mW EIRP; maximum antenna gain in front of meter is 3.66; antenna gain drops by 20 times behind meter and inside the home.
- Cell Phone Specification: duty cycle 45%; peak transmitter power after antenna is 600 mW EIRP; distance 1 cm.
The PUCT report characterizes the Naperville device comparisons as an attempt “to put RF EMF emissions from its smart meters into perspective.”
Technically Meaningless Comparisons and What Is Actually Relevant
First of all, the above Naperville comparison includes a false premise that assumes there is technical relevance in making a comparison between the “RF energy” of one type of device (a cell phone) with the “RF energy” of a totally different device such as a wireless smart meter. Such comparisons may be warranted when considering short-term thermal effects of radiofrequency (RF) exposure but are not likely of major significance when considering the possible effects of chronic exposure to pulsed RF radiation emitted from smart meters.
As described in The BioInitiative Report 2012: “There is increasing reason to believe that the critical factor for biologic significance is the intermittent pulse of RF, not the time-averaged SAR [specific absorption rate]. … Real-world experience is revealing worrisome evidence that … people can be adversely affected by placing new wireless pulsed RFR transmitters (utility meters on the sides or interiors of homes), even when the time-weighted average for RFR is miniscule.”
Due to evidence of observed biological effects from RF radiation at extremely low levels, The BioInitiative Report 2012 established precautionary action levels within the range of 0.0003 to 0.0006 microwatts/cm2 for chronic exposure to pulsed RF radiation.
Finally, although one may perform an exercise in an attempt to compare possible exposures between a cell phone and a smart meter, the results of such calculations are nearly impossible to evaluate in terms of an “apples upon apples” comparison. A calculated exposure for a cell phone placed near the head is a localized exposure. The exposure calculated for a smart meter at a greater distance is more uniform in nature to the whole body. Thus, more surface area of the whole body is exposed to the RF field strength values calculated for the smart meter than is for the cell phone. For that reason, such calculations inherently underestimate the potential exposures due to wireless emissions from the smart meter (at least when plotted on the same graph with cell phone values representing localized exposures).
Naperville Device Comparison Assumptions
1. Cell Phone Power
The “cell phone specifications” used by the City Naperville in its comparison analysis are arbitrary and unreasonable. It is possible that such phone specifications were valid at some time in the past, but certainly not for all cell phones currently in use today. The City of Naperville assumes a peak cell phone transmitter power of 600 milliwatts and uses a duty cycle of 45%. Again, without any further explanation by the City, these assumptions can be concluded to be completely biased or chosen by an uninformed person.
In a submittal to the Federal Communications Commission (FCC), dated September 3, 2013, the Telecommunications Industry Association (TIA) indicated that “recent analyses of actual exposure conditions demonstrate that the systems currently operate to provide exposures well below that expected by users who refer to reported SAR levels. A recent Swedish study found that after assessing output power from more than 800,000 hours of voice calls, the average level for 3G or smartphone voice calls was below 1 mW across all environments, including rural, urban, and dedicated indoor networks.”
Rather than using a fictitious number for cell phone power output, let’s use the results of a peer-reviewed study, namely a representative “average output power” of 1 milliwatt.
2. Cell Phone Duty Cycle
Smart grid industry “experts” apparently are not familiar with current cell phone technology. Depending on the technology, cell phones incorporate a number of features that reduce the average power output as compared to the peak power output, including adaptive power control, time-slotted modulation, discontinuous transmission (DTX), and power control (PWC). These features contribute to an effective device duty cycle which is typically less than 1%, consistent with the above statements from the Telecommunications Industry Association. In addition to the average power output of a cell phone being much less than its maximum, the true duty cycle should be calculated based upon the duration of time that the device is used over a period 24 hours. In the Naperville device comparison, the cell phone is used for a period of 3 minutes. Thus, the maximum “duty cycle” based upon time-of-use would be 3 minutes divided by 1440 minutes/day, or 0.2%.
3. Cell Phone Distance from Head
Another area where the Naperville cell phone calculation is not necessarily representative of actual phone use conditions is where it is assumed that a person holds the phone 1 cm from the body. This assumption is arbitrary. If you were performing calculations regarding maximum possible exposure scenarios for voluntary phone use, this value could be used, but that is not the purpose of these calculations. The EPRI field strength values typically quoted in smart grid industry documents that range from 1000 to 5000 microwatts/cm2 involve exposure to an “imaginary” cell phone with a continuous power output of 250 milliwatts and where the phone is held at a distance from head or ear ranging from 1 cm to 2 inches. Just to pick a distance in the middle of that range, let us use one (1) inch for model calculations.
These selected distance values are somewhat arbitrary, and as will be later demonstrated, another possible arrangement would be to use a hands-free phone using a distance of about a foot or so. Please remember it is not the phone itself that is the source of radiation, but the antenna which either extends outward from the phone or is embedded within the device itself. In addition, as a person uses a cell phone, it is not “locked” in place, and the person would likely adjust orientation of the phone periodically such that the same localized areas are not constantly exposed to the maximum possible exposure level.
4. Smart Meter Duty Cycle
The next major unreasonable and biased assumption by the City of Naperville is with regard to the assumed smart meter duty cycle of 0.1%. This value is likely a design specification value for one meter operating in isolation, not as part of a mesh network. As part of a network, the duty cycle of a smart meter can dramatically increase due to performing several functions, such as network management, time synchronization, and activities related to forwarding routed messages for other customers.
For a person with a concern about wireless smart meter emissions, the concern is over (involuntary) potential exposure for oneself and family, not an exposure calculated based upon a meter design specification. In fact, several smart meter measurement test studies show that at least some smart meters involved with each study have duty cycles in the range of 3% to 4% to 5%, depending on the study. Since the average person does not possess the equipment necessary to measure or otherwise know the actual RF emissions from a wireless smart meter located on his or her property, at a minimum, it must be assumed that the duty cycle is the maximum value measured in the field.
One of the smart grid industry’s most touted reports is called, “Health Impacts of Radiofrequency from Smart Meters,” Final Report, dated April 2011, published by the California Council on Science and Technology (CCST). In that CCST document a 5% duty cycle is referred to as a “Typical Smart Meter Operation with Repeater Activity.”
Finally, duty cycles are normally measured or assigned for purposes of calculating the average RF field strength of a wireless device over time. Although such calculations are relevant for evaluating possible adverse biological effects caused by a thermal mechanism, they are of little use in evaluating possible effects that would be due to chronic exposure to pulsed or modulated RF emissions where a non-thermal mechanism may be involved. Thus, although an exercise may be performed to calculate average RF field intensity values, they would not be used to evaluate chronic exposure to RF emissions from smart meters. In those instances, instantaneous RF field intensity values for a transmitting smart meter should be compared to the precautionary action levels of documents such as The BioInitiative Report 2012.
5. Antenna Gain Assumptions
Another Naperville assumption that can be challenged as non-conservative for model calculation purposes is the antenna gain dropping by 20 times behind the meter and inside the home. This assumption is used to characterize a somewhat typical arrangement where the smart meter only faces away from other building walls and where there are no reflective wave conditions that might actually increase exposure with distance away from the smart meter. This is not always the case and again, the concern is regarding (involuntary) potential exposure for oneself and family, not an exposure calculated based upon a non-conservative model. What you see below is the layout for an actual home where the smart meter faces directly towards the main bedroom. In this case, a baby’s crib, for example, may be positioned as close as 3 to 4 feet from the smart meter. There would likely be some attenuation by the bedroom wall but this could be countered by reflective wave conditions as well as construction materials or windows in some bedroom walls offering little if any attenuation to RF emissions. Furthermore, there is evidence that RF radiation emitted from a wireless digital electric meter in the 900 MHz range enters the home through a conductive mechanism and reradiates into rooms through conductive objects such as wiring and table lamps. It is therefore unwise to make any assumptions regarding an attenuation that may or may not be applicable for being “behind” a smart meter.

Revised Comparison Calculations
Based upon the above analysis, we have shown that Naperville assumptions for cell phone and smart meter comparisons were either erroneous or inappropriately non-conservative. More appropriate values that should be used in technically valid operational scenario calculations are summarized below:

Regarding calculations for field intensity values for cell phones over short distances, there are wave size and geometry considerations that make such calculations inappropriate even though the smart grid industry insists on making them. The problems associated with making such calculations and associated measurements are why cell phone exposure limit values are expressed in units of SAR or specific absorption rate rather than in terms of units such as microwatts/cm2.
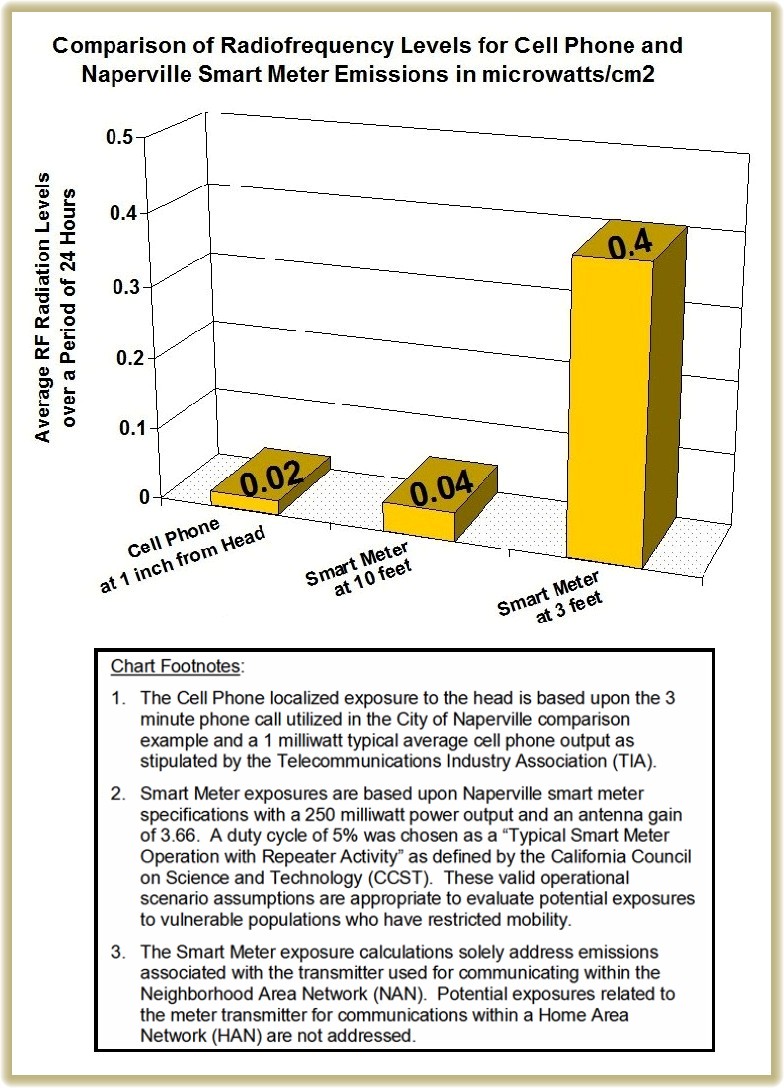
Nevertheless, rough estimates can be made and the value calculated by SkyVision Solutions for a cell phone held one (1) inch from the head and with a power output of 1 milliwatt is about 10 microwatts/cm2. If one corrects this exposure value for a duty cycle of 0.2% (for a 3-minute phone call in a day), the resultant exposure to the user’s head over the course of a 24-hour day is 0.02 microwatts/cm2.
Moving on to smart meters, using the Naperville smart meter with a design specification power output of 250 milliwatts and an antenna gain of 3.66, both the instantaneous RF power density values during signal transmission and the average exposure levels for a smart meter with a duty cycle of 5% are shown below.
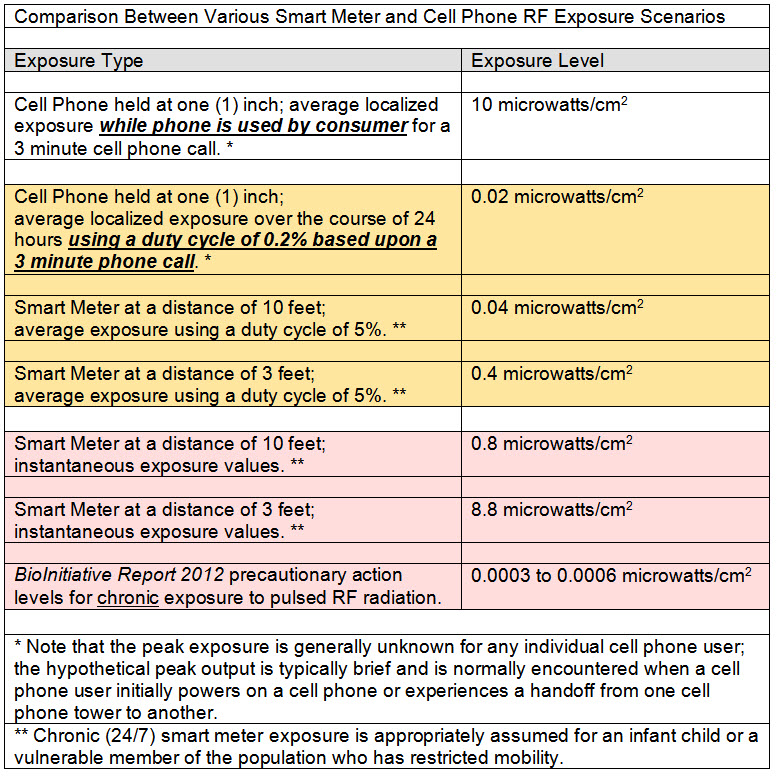
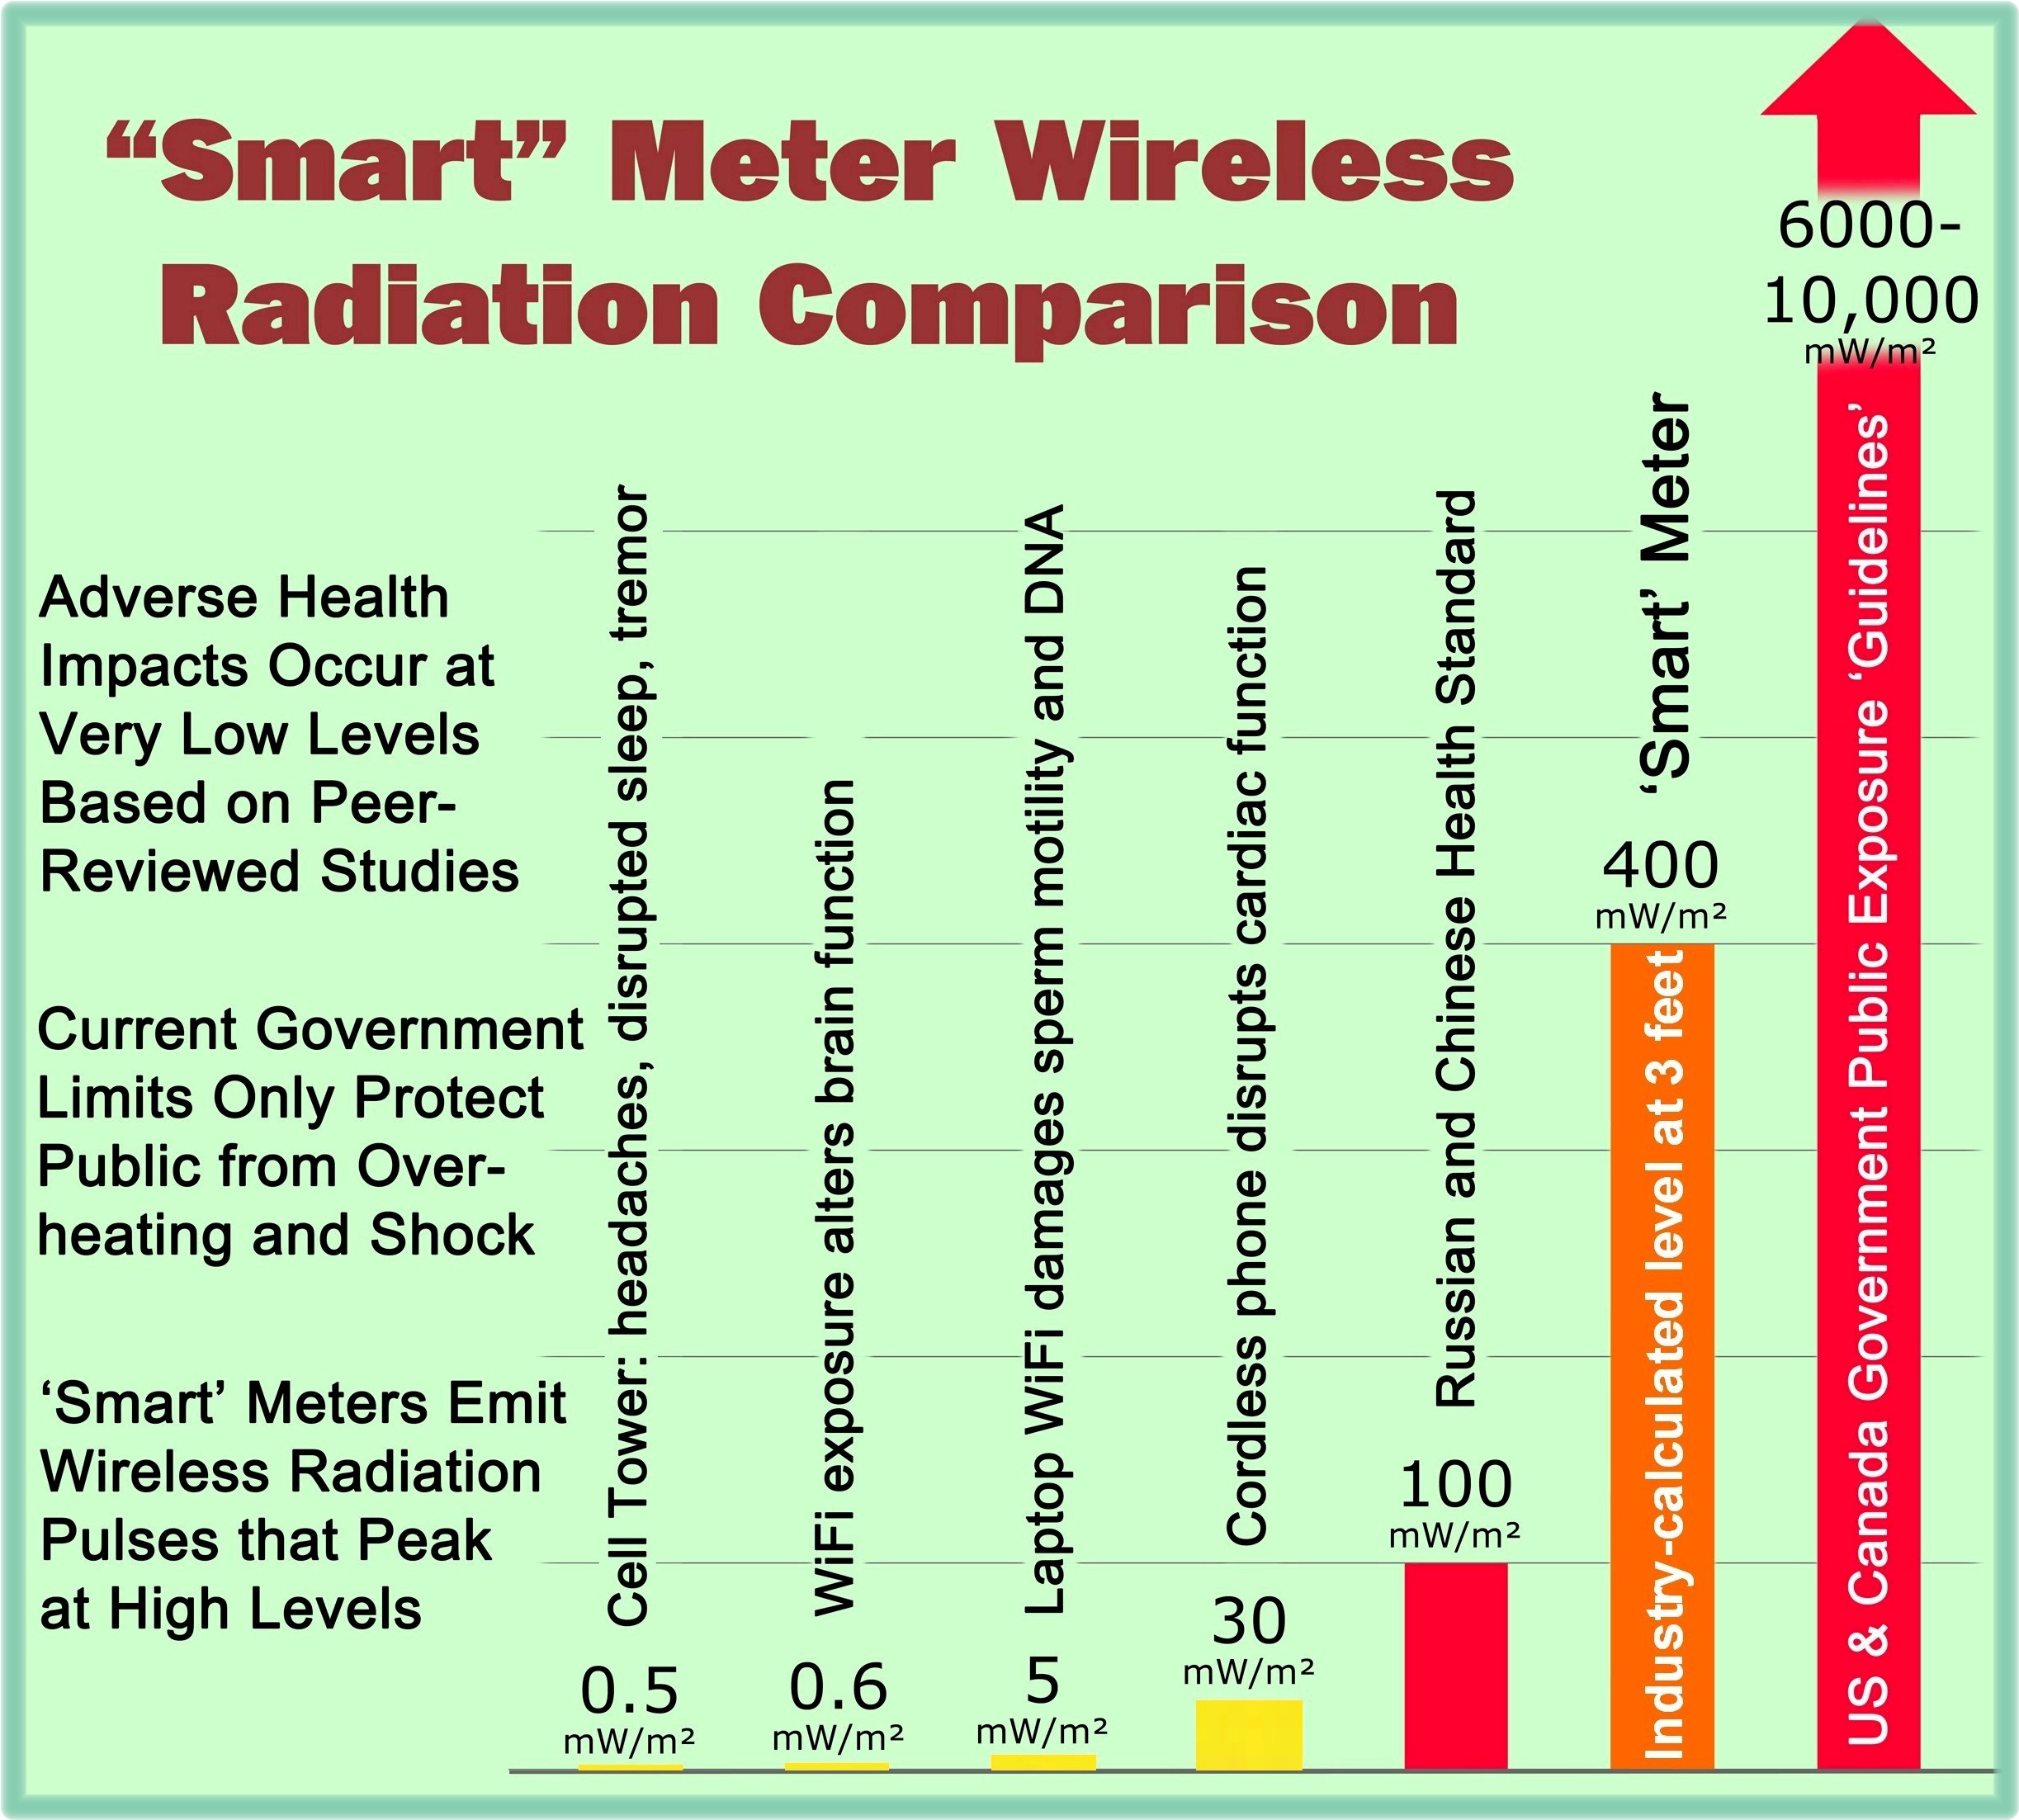
As can be seen from the information summarized in the above table, it is absurd for the City of Naperville to state that one would need to be exposed to a smart meter for 100 to 200 years to receive the same RF energy as a 3 minute cell phone.
In actuality, based upon the appropriate and reasonable assumptions made as part of this analysis, one can conclude the following:
- A person can receive twice as much RF energy from exposure to a Naperville smart meter over the course of a day at a distance of 10 feet as compared to the localized exposure received from making a 3-minute cellular phone call.
- A person can receive 20 times more RF energy from exposure to a Naperville smart meter over the course of a day at a distance of 3 feet as compared to the localized exposure received from making a 3-minute cellular phone call.
Refer to the chart below to more easily conceptualize how the average smart meter exposures can exceed the localized cell phone call exposure over the course of a 24 hour period.
It is not asserted that the above calculated smart meter exposures will be typical for everyone. However, it is claimed that the above calculated exposures are valid scenarios that should be considered when assessing potential exposures to consumers who may have specific living arrangements within their homes that would make these scenarios applicable to their situations. This would be particularly true for vulnerable members of our population who have restricted mobility and spend most or all of their time in one room of a home.
More importantly, beyond the discussion of exposure to RF emissions based upon averaging over a 24-hour period, the relevant parameter for evaluating potential adverse health effects is the chronic exposure to frequent and pulsed signals from a smart meter. In this example scenario, the instantaneous power density values for a smart meter during signal transmission of 0.8 and 8.8 microwatts/cm2 for 10 feet and 3 feet respectively are those of interest in comparison to The BioInitiative Report 2012 precautionary action levels. With action levels being in the range of 0.0003 to 0.0006 microWatts/cm2 for chronic exposure to pulsed RF radiation, it is evident that smart meter instantaneous exposure levels are over a thousand times higher than those expected to be able to cause observed negative health effects.
Also note that the 3-minute cell phone call exposure is not considered chronic, and thus The BioInitiative Report action levels are not as relevant for that exposure type.
Relevant Information from Another Industry Document
There is additional revealing information in a report entitled, “An Evaluation of Radio Frequency Fields Produced by Smart Meters Deployed in Vermont,” by Richard Tell Associates, Inc. In that report, measurements were made of RF fields produced by a cellular phone, a Samsung Model Blackjack II, “to provide perspective on potential exposure to cell phones and smart meters.” It was noted that “there [were] abrupt changes in the signal level (RF field) at different times during the test call suggesting that the phone is dynamically changing its power in response to the mobile phone base station to which it is connected at the time.”
Furthermore, according to Richard Tell Associates:
“Cell phones make use of transceivers that, in terms of power and frequencies used, are not very different from the transceivers in smart meters. Thus, one would not expect that there would be very much difference in exposure between the two devices except for the fact that cell phones are intended to be used against the body while smart meters are not. In a measurement of the spatially averaged RF field over a six-foot vertical dimension, with the phone positioned at five feet above the floor, the field was found to be equivalent to 0.070% of the MPE. Interestingly, this is in quite close agreement with the value obtained for the maximum field smart meter in terms of time-averaged field, including spatial averaging of 0.068% of the MPE.” [emphasis added]
The above language is a bit technical, but do you realize what this means? The Richard Tell Associates’ time averaged RF measurement results for a smart meter were almost identical to those of the cellular phone, measured in the same configuration. This configuration was such that when the measurement device was placed at a height of five feet, that it was located one (1) foot away from the smart meter/cell phone being measured. For the cell phone measurement at one foot, the exposure is similar to that experienced while using a hands-free kit.
The counter argument by detractors to the above professionally documented test evidence is that people are not normally located at a distance one (1) foot away from a smart meter. With the above information as background, however, it is possible to now provide perspective and make an “apples upon apples” comparison based upon actual test data, not just theoretical calculations. The Tell study provides a credible mechanism to compare cell phone and smart meter power density levels in a way that was based upon the same spatial configuration. These spatially averaged test results help account for the difficulties mentioned earlier in this article that result from calculations made for a localized cell phone exposure to the head as compared to a more uniform exposure resulting from a smart meter at some distance away in feet.
In addition, the Tell test results help dispel misleading and erroneous statements made by the smart grid industry that “RF signals used by smart meters are much weaker than the RF signals from cell phones.” … and of course the absurd statement made by the City of Naperville that: “a person sitting 10 feet in front of their smart meter would have to be there for more than 100 years to receive the same RF energy that they would receive from a 3-minute cell phone call.”
Something to emphasize is that based upon testing performed by one of the smart grid industry’s most respected testing companies, one can say that: “You can stand in front of a smart meter and get the same amount of radiation as you would get from a ‘hands-free’ cell phone call, minute for minute, during the call.” Why would the City of Naperville or other smart grid-related organizations not want to advertise this device comparison based upon actual testing, at least as one example? Could there be bias involved?
Summary
It has been shown that the statements made by the City of Naperville regarding smart meter exposures and cell phones are based upon erroneous and inappropriate assumptions. Correcting those assumptions, the actual calculated field strength values in microwatts/cm2 can be shown to be quite similar for the two types of devices. In fact, it has been demonstrated that the RF field strength values for a smart meter averaged over a period of 24 hours can well exceed the localized exposure received from intermittent cell phone use for that same 24 hour period. Beyond that, however, the comparisons are of little technical relevance since field strength intensity is only part of the information necessary to evaluate potential effects. Biological effects likely vary based upon frequency and modulation of a signal such that a very weak signal may have a significant biological effect.
Finally, it must be considered that mandated smart meter exposure is chronic and involuntary in nature. The smart meter field intensity values calculated in this paper exceed The BioInitiative 2012 Report action levels based upon the fact that they are pulsed and chronic in nature. It is one thing for an adult to engage in a voluntary 3-minute cell phone call. It is quite another to allow an infant child to sleep in a crib or live in a room (for an indefinite period of time) located a few feet from a wireless smart meter. Put another way, the pulsed and chronic RF emissions exposure from forced smart meter installations can not be fairly compared to an individual’s voluntary and intermittent use of a cell phone. Such a comparison represents deceptive industry spin.
Expanded Version of this Blog Posting
This blog posting is a somewhat abbreviated version of a document prepared by SkyVision Solutions entitled, “Analysis of the City of Naperville Comparison Between Cell Phone and Smart Meter Exposure Levels.” The PDF version of this article also includes a “References and Notes” section that more fully documents the bases for calculations made as a part of this article and a more formal listing of applicable published references. To view or download the entire document, refer to the following link:
Naperville Smart Meter Comparison with Cell Phones.05 May 2014
Broader Implications of this Blog Posting Critical Review and Analysis
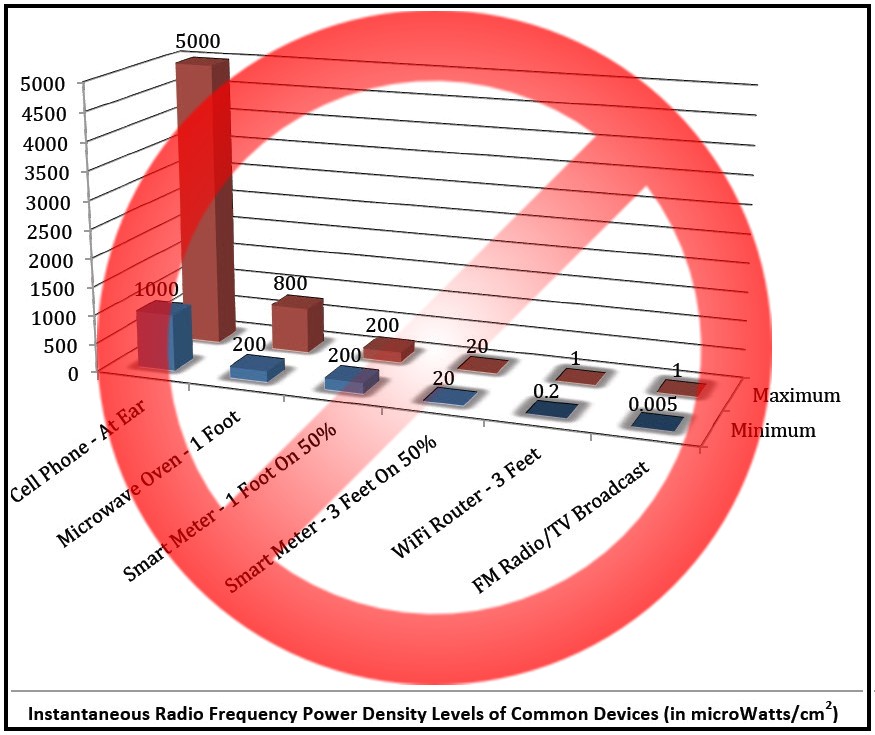 Using the same basic information contained in this blog posting, the somewhat notorious CCST red and blue charts showing cell phone exposures far exceeding those of smart meters can be cut down to size so to speak in order to provide more a realistic presentation of data. These red and blue colored charts have been spread like wildfire throughout the smart grid industry and accepted as unquestionable truth. They are not. Unfortunately, they represent misinformation. In addition, the microwave oven data presented in the EPRI and CCST tables and charts are based primarily on hypothetical leakage rates and not actual test data. For example, Richard Tell Associates in a document entitled, “Summary Discussion of RF Fields and the PG&E SmartMeter System (2005 Report and 2008 Supplement),” states that a “Typical RF field in kitchen with operating microwave [1 meter]” is 10 microwatts per cm2. Why not use that value for the microwave oven in industry charts as it is much closer to (if not less than) the value normally quoted for smart meter exposure levels at the same distance?


A qui de droit et sans préjudice à mes droits
Le 25 Novembre 2013 + – j’ai demander à ma compagnie d’assurance la Promutuel
qui assure ma maison depuis plusieurs années et je leur ai demandé que si les
nouveaux Compteur intéligent de Hydro-Québec provoque une incendie à ma
maison familliale si il vont payer les dommages occasionés.
J’ai averti ma compagnie d’assurance que le nouveaux Compteurs intéligent
avait provoquer déjà un incendie à Montréal et ailleur dans le monde et même
les Compteurs le plastic fonde, brûle ect
Les pompiers de certaine ville ont affirmé que se sont bien c’est Compteur intéligent
qui ont provoque l’incendie et les déclares extrèments dangereux
Je suis déçu en le 31 Janvier 2014 car j’attend leur réponse si je suis couvert oui ou non
Je demande à la Régie d’interdire à Hydro-Québec de changé mon compteur à roulette
qui lui est sécuritaire et non dangereux pour la santé et non incendiaire ect